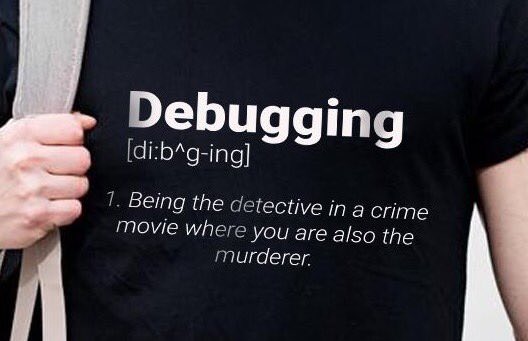
Debugging
Debugging is very hard to teach and is one of the skills that just comes with experience. That said, there are good
and bad ways to debug a program. We are all probably familiar with just inserting print(...) statements everywhere
in our code. It is easy and can many times help narrow down where the problem happens. That said, this is not a great
way of debugging when dealing with a very large codebase. You should therefore familiarize yourself with the built-in
python debugger as it may come in handy during the course.
To invoke the built-in Python debugger you can either:
-
Set a trace directly with the Python debugger by calling
anywhere you want to stop the code. Then you can use different commands (see the
python_debugger_cheatsheet.pdf) to step through the code. -
If you are using an editor, then you can insert inline breakpoints (in VS Code this can be done by pressing
F9) and then execute the script in debug mode (inline breakpoints can often be seen as small red dots to the left of your code). The editor should then offer some interface to allow you step through your code. Here is a guide to using the built-in debugger in VScode. -
Additionally, if your program is stopping on an error and you automatically want to start the debugger where it happens, then you can simply launch the program like this from the terminal
❔ Exercises
We here provide a script vae_mnist_bugs.py which contains a number of bugs that need to be fixed to get it running.
Start by going over the script and try to understand what is going on. Afterwards, try to get it running by fixing the
bugs. The following bugs exist in the script:
- One device bug (will only show if running on gpu, but try to find it anyways)
- One shape bug
- One math bug
- One training bug
Some of the bugs prevent the script from running at all, while some of them influence the training dynamics. Try to
find them all. We also provide a working version called vae_mnist_working.py (but please try to find the bugs before
looking at the script). Successfully debugging and running the script should produce three files:
orig_data.pngcontaining images from the standard MNIST training setreconstructions.pngreconstructions from the modelgenerated_samples.pngsamples from the model
Again, we cannot stress enough that the exercise is not actually about finding the bugs but using a proper debugger to find them.
Solution for device bug
If you look at the reparameterization function in the Encoder class you can see that we initialize a noise tensor
def reparameterization(self, mean, var):
    """Reparameterization trick to sample z values."""
    epsilon = torch.randn(*var.shape)
    return mean + var * epsilon
this will fail with a
RuntimeError: Expected all tensors to be on the same device, but found at least two devices, cuda:0 and cpu! if
you are running on GPU, because the noise tensor is initialized on the CPU. You can fix this by initializing the
noise tensor on the same device as the mean and var tensors.
Solution for shape bug
In the Decoder class we initialize the following fully connected layers
self.FC_hidden = nn.Linear(latent_dim, hidden_dim)
self.FC_output = nn.Linear(latent_dim, output_dim)
which are used in the forward pass as
def forward(self, x):
    """Forward pass of the decoder module."""
    h = torch.relu(self.FC_hidden(x))
    return torch.sigmoid(self.FC_output(h))
This means that h should be a tensor of shape [bs, hidden_dim], but since we initialize the FC_output
layer with latent_dim output dimensions, the forward pass will fail with a
RuntimeError: size mismatch, m1: [bs, hidden_dim], m2: [bs, latent_dim] if hidden_dim != latent_dim. You can
fix this by initializing the FC_output layer with hidden_dim output dimensions.
Solution for math bug
In the Encoder class you have the following code:
def forward(self, x):
    """Forward pass of the encoder module."""
    h_ = torch.relu(self.FC_input(x))
    mean = self.FC_mean(h_)
    log_var = self.FC_var(h_)
    z = self.reparameterization(mean, log_var)
    return z, mean, log_var

def reparameterization(self, mean, var):
    """Reparameterization trick to sample z values."""
    epsilon = torch.randn(*var.shape)
    return mean + var * epsilon
From just the naming of the variables you can see that log_var is the log of the variance and not the variance
itself. This means that you should exponentiate log_var before using it in the reparameterization function.
Alternatively, we can convert to using the standard deviation instead of the variance
and
Solution for training bug
Any training loop in PyTorch should have the following structure:
for epoch in range(num_epochs):
    for batch in dataloader:
        optimizer.zero_grad()
        loss = model(batch)
        loss.backward()
        optimizer.step()
If you look at the code for the training loop in the vae_mnist_bugs.py script you can see that the optimizer is
not zeroed before the backward pass. This means that the gradients will accumulate over the batches and will
explode. You can fix this by adding the line
to the beginning of the inner training loop.
