![]()
Logging
Core Module
Logging in general refers to the practice of recording events over time. Having proper logging in your applications can be extremely beneficial for a few reasons:
-
Debugging becomes easier because we in a more structured way can output information about the state of our program, variables, values, etc. to help identify and fix bugs or unexpected behavior.
-
When we move into a more production environment, proper logging is essential for monitoring the health and performance of our application.
-
It can help in auditing, as logging info about specific activities, etc. can help keeping a record of who did what and when.
-
Having proper logging means that info is saved for later, which can be analysed to gain insight into the behavior of our application, such as trends.
We are in this course going to divide the kind of logging we can do into categories: application logging and experiment logging. In general application logging is important regardless of the kind of application you are developing, whereas experiment logging is important in machine learning-based projects where we do experiments.
Application logging
The most basic form of logging in Python applications is the good old print statement:
for batch_idx, batch in enumerate(dataloader):
    print(f"Processing batch {batch_idx} out of {len(dataloader)}")
    ...
This will keep a "record" of the events happening in our script, in this case how far we have progressed. We could even
change the print to include something like batch.shape to also have information about the current data being
processed. Using print statements is fine for small applications, but to have proper logging we need a bit more
functionality than what print can offer. Python actually comes with a great
logging module that defines functions for flexible logging. However,
it does require a bit more setup than just using print:
import logging
logger = logging.getLogger(__name__)
logger.setLevel(logging.INFO)
logger.info("This is an info message")
For this reason we are instead going to look at the loguru package which makes Python
logging (stupidly) easy. Logging with loguru is essentially as easy as using print:
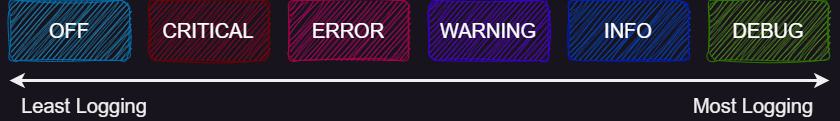
The only core different is that we need to understand what log levels are and how to use them. Levels essentially allow us to get rid of statements like this:
where the logging is conditional on the variable debug which we can set at runtime. Thus, it is something we can
disable for users of our application (debug=False) but have enabled when we develop the application (debug=True).
And it makes sense that not all things logged should be available to all stakeholders of a codebase. We as developers
probably always want the highest level of logging, whereas users of our code need less info, and we may want to
differentiate this based on users.
It is also important to understand the difference between logging and error handling. Error handling in
Python is done using raise statements and try/catch like:
def f(x: int):
    if not isinstance(x, int):
        raise ValueError("Expected an integer")
    return 2 * x

try:
    f(5):
except ValueError:
    print("I failed to do a thing, but continuing.")
Why would we ever need log warning, error, critical levels of information, if we are just going to handle it?
The reason is that raising exceptions are meant to change the program flow at runtime e.g. things we do not want the
user to do, but we can deal with in some way. Logging is always for after a program has run, to inspect what went
wrong. Sometimes you need one, sometimes the other, sometimes both.
❔ Exercises
If in doubt, always refer to the documentation for help.
-
Start by installing
loguru: -
Create a script called
my_logger.pyand try logging a few messages usingloguru. Make sure to log at least one message of each level:debug,info,warning,errorandcritical.Solution
-
Configure the logging level such that only messages of level
warningand higher are shown. Confirm by rerunning the script. -
Instead of sending logs to the terminal, let's instead log to a file. This can be beneficial, such that only
warninglevel logs and higher are available to the user, butdebugandinfoare still saved when the application is running. Change the code such that logs are saved to a file calledmy_log.log.-
A common problem with logging to a file is that the file can grow very large over time. Luckily, loguru has a built-in feature for rotating logs. Add this feature to the logger, such that the log file is rotated when it reaches 100 MB.
-
-
(Optional) Play around with some of the other features that loguru provides such as:
logger.catchfor catching errors and sending them to the logger, theformatargument for changing the format (and color) of the logs and theoptmethod for lazy evaluation of logs. -
(Optional) We already briefly touched on logging during the module on config files using hydra. Officially,
loguruandhydrado not really integrate becausehydrauses the standard Python logging module. However, you can still useloguruwithhydraby configuringloguruto save a log file to the same location as hydra is saving its logs. Try implementing this in your hydra project.Solution
Experiment logging
When most people think machine learning, we think about the training phase. Being able to track and log experiments is an important part of understanding what is going on with your model while you are training. It can help you debug your model and help tweak your models to perfection. Without proper logging of experiments, it can be really hard to iterate on the model because you do not know what changes led to increase or decrease in performance.
The most basic logging we can do when running experiments is writing the metrics that our model is producing, e.g. the loss or the accuracy to the terminal or a file for later inspection. We can then also use tools such as matplotlib for plotting the progression of our metrics over time. This kind of workflow may be enough when doing smaller experiments or working alone on a project, but there is no way around using a proper experiment tracker and visualizer when doing large-scale experiments in collaboration with others. It especially becomes important when you want to compare performance between different runs.
There exist many tools for logging your experiments, with some of them being:
All of the frameworks offer many of the same functionalities, you can see a (biased) review comparing experiment tracking tools. We are going to use Weights and Bias (wandb), as it supports everything we need in this course. Additionally, it is an excellent tool for collaboration and sharing of results.
❔ Exercises
-
Start by creating an account at wandb. I recommend using your GitHub account but feel free to choose what you want. When you are logged in you should get an API key of length 40. Copy this for later use (HINT: if you forgot to copy the API key, you can find it under settings), but make sure that you do not share it with anyone or leak it in any way.
.env file
A good place to store not only your wandb API key but also other sensitive information is in a
.envfile. This file should be added to your.gitignorefile to make sure that it is not uploaded to your repository. You can then load the variables in the.envfile using thepython-dotenvpackage. For more information see this page. -
Next install wandb on your laptop.
-
Now connect to your wandb account.
You will be asked to provide the length-40 API key. The connection should remain open to the wandb server even when you close the terminal, such that you do not have to log in each time. If using
wandbin a notebook you need to manually close the connection usingwandb.finish(). -
We are now ready to incorporate
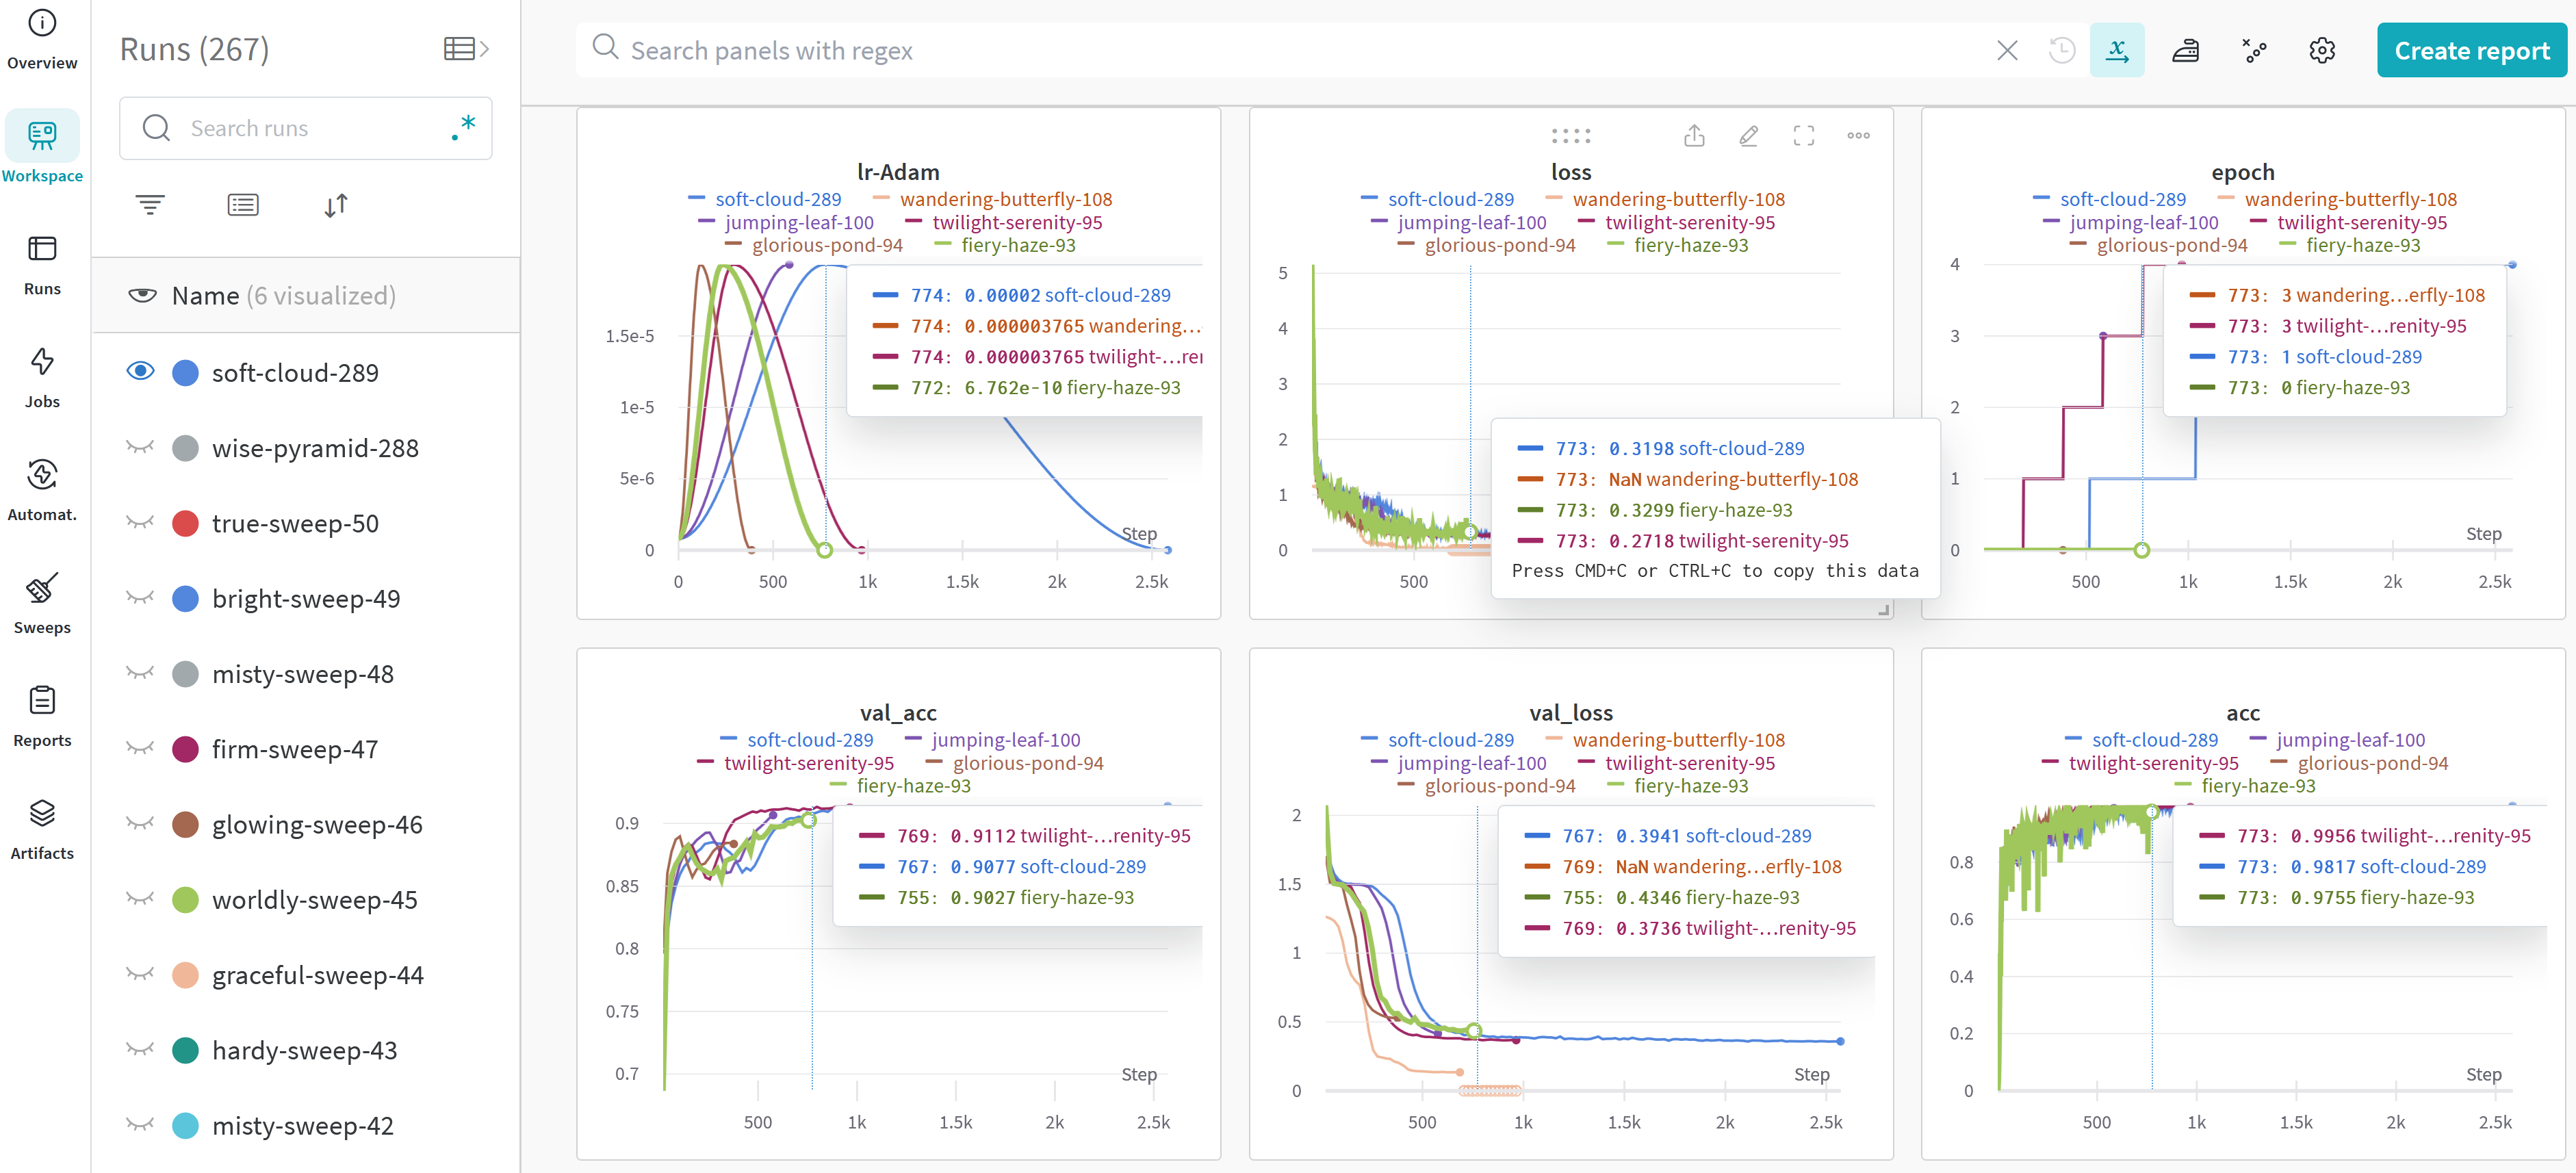
wandbinto our code. We are going to continue development on our corrupt MNIST codebase from the previous sessions. For help, we recommend looking at this quickstart and this guide for PyTorch applications. Your first job is to alter your training script to includewandblogging which at least does the following:- Logs the hyperparameters of the model (the configuration).
- Logs the training loss and tranining accuracy at each training step.
Solution
-
After running your model, check out the webpage. Hopefully you should be able to see at least one run with something logged.
-
Now log something other than scalar values. This could be an image, a histogram or a matplotlib figure. In all cases the logging is still going to use
wandb.logbut you need extra calls towandb.Image, etc. depending on what you choose to log.Solution
In this solution we log the input images to the model every 100 steps. Additionally, we also log a histogram of the gradients to inspect if the model is converging. Finally, we create an ROC curve which is a matplotlib figure and log that as well.
-
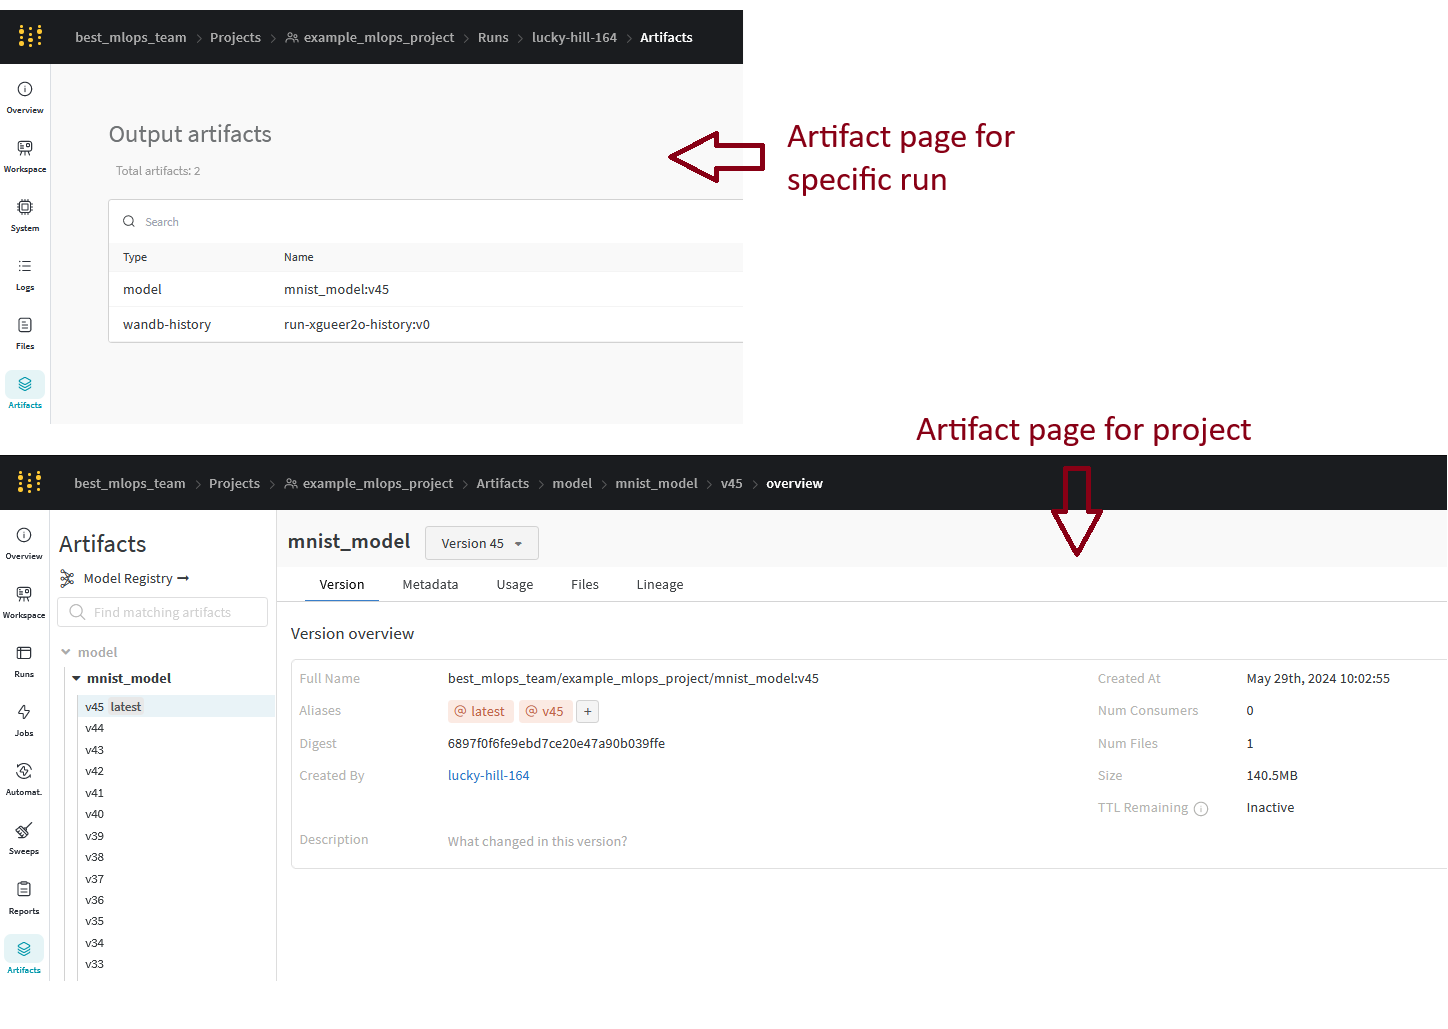
Finally, we want to log the model itself. This is done by saving the model as an artifact and then logging the artifact. You can read much more about what artifacts are in the wandb artifacts guide, but they are essentially one or more files logged together with runs that can be versioned and equipped with metadata. Log the model after training and see if you can find it in the wandb dashboard.
Solution
In this solution we have added the calculating of final training metrics and when we then log the model we add these as metadata to the artifact.
After running the script you should be able to see the logged artifact in the wandb dashboard.
-
Going back to yesterdays topic on reproducibility, wandb also has great support for this. Assuming you now have done a few runs with wandb, where can you find information about a run that would let you reproduce it and what would the steps be to reproduce it (assuming code is stored in a git repository)?
Solution
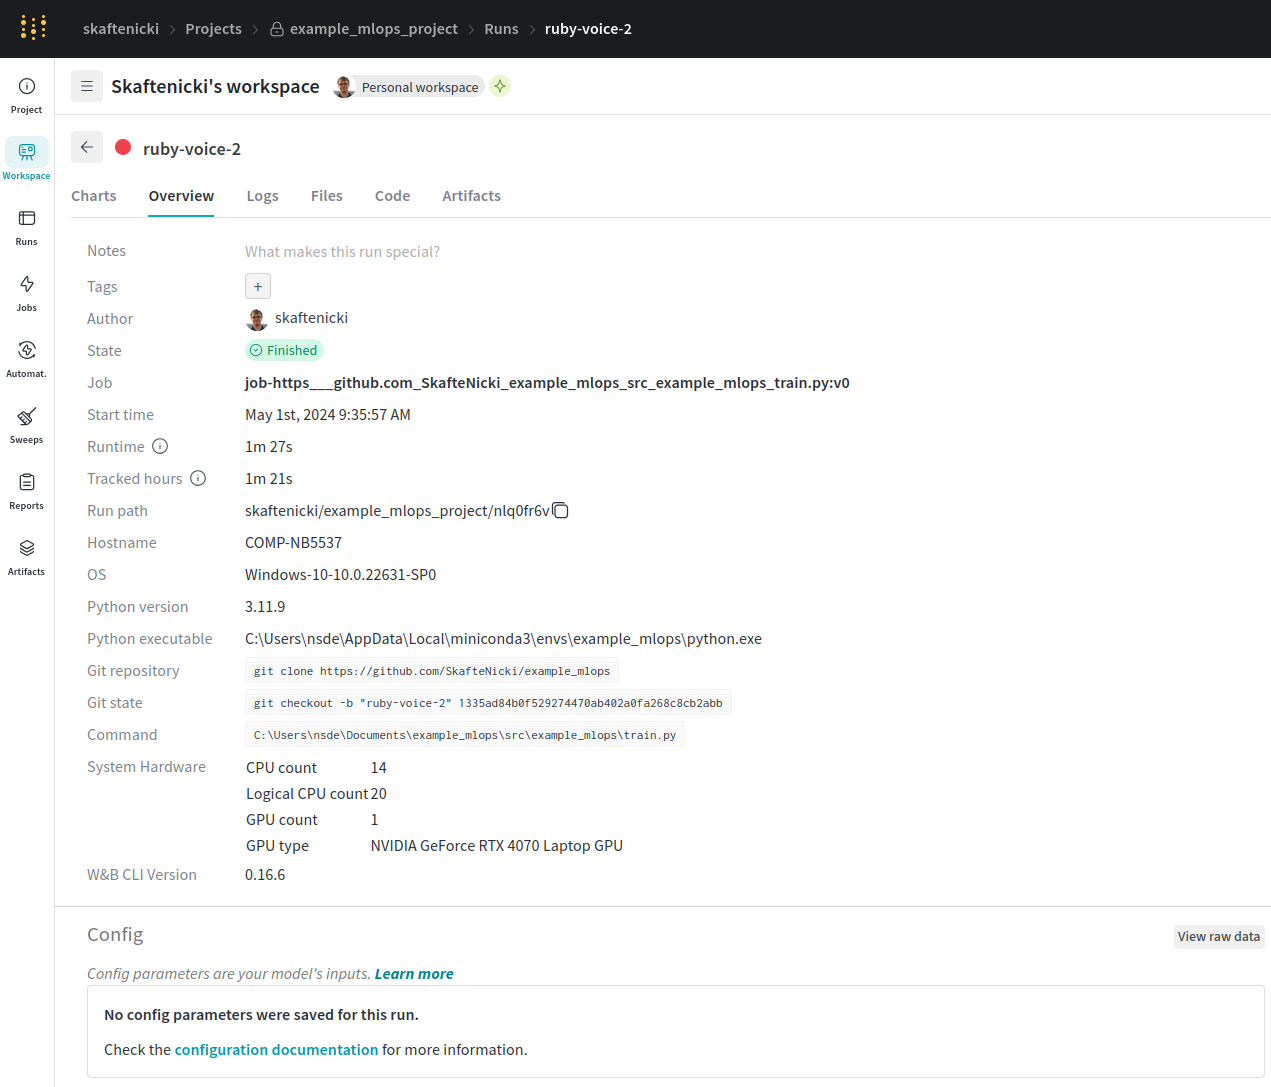
If you go to any run page in the wandb dashboard and click the
Overviewtab you can find the following information is available for reproducibility:- The git repository URL (if the code was in a git repository).
- The exact git commit hash used for the run (if the code was in a git repository).
- The exact command used to launch the run.
- The exact system environment (OS, Python version, installed packages, etc.) used for the run.
If you go to the
Filestab you will also find that it has taken a snapshot of the script that was run (but not the full source code) and created arequirement.txtfile with the installed packages. The steps to reproduce the run would then be:- Git clone the repository.
- Checkout the specific commit hash.
- Install dependencies, either by downloading the generated
requirements.txtfile or if the project comes with arequirements.txt/uv.lockfile use that. - Run the exact same command as logged in the wandb dashboard.
-
Weights and bias was created with collaboration in mind and let's therefore share our results with others.
-
Let's create a report that you can share. Click the Create report button (upper right corner when you are in a project workspace) and include some of the graphs/plots/images that you have generated in the report.
-
Make the report shareable by clicking the Share button and create a view-only-link. Send a link to your report to a group member, fellow student or a friend. In the worst case that you have no one else to share with you can send a link to my email
nsde@dtu.dk, so I can check out your awesome work 😃
-
-
When calling
wandb.inityou can provide many additional arguments. Some of the most important areprojectentityjob_type
Make sure you understand what these arguments do and try them out. It will come in handy for your group work as they essentially allow multiple users to upload their own runs to the same project in
wandb.Solution
Relevant documentation can be found here. The
projectindicates what project all experiments and artifacts are logged to. We want to keep this the same for all group members. Theentityis the username of the person or team who owns the project, which should also be the same for all group members. The job type is important if you have different jobs that log to the same project. A common example is one script that trains a model and another that evaluates it. By setting the job type you can easily filter the runs in the wandb dashboard.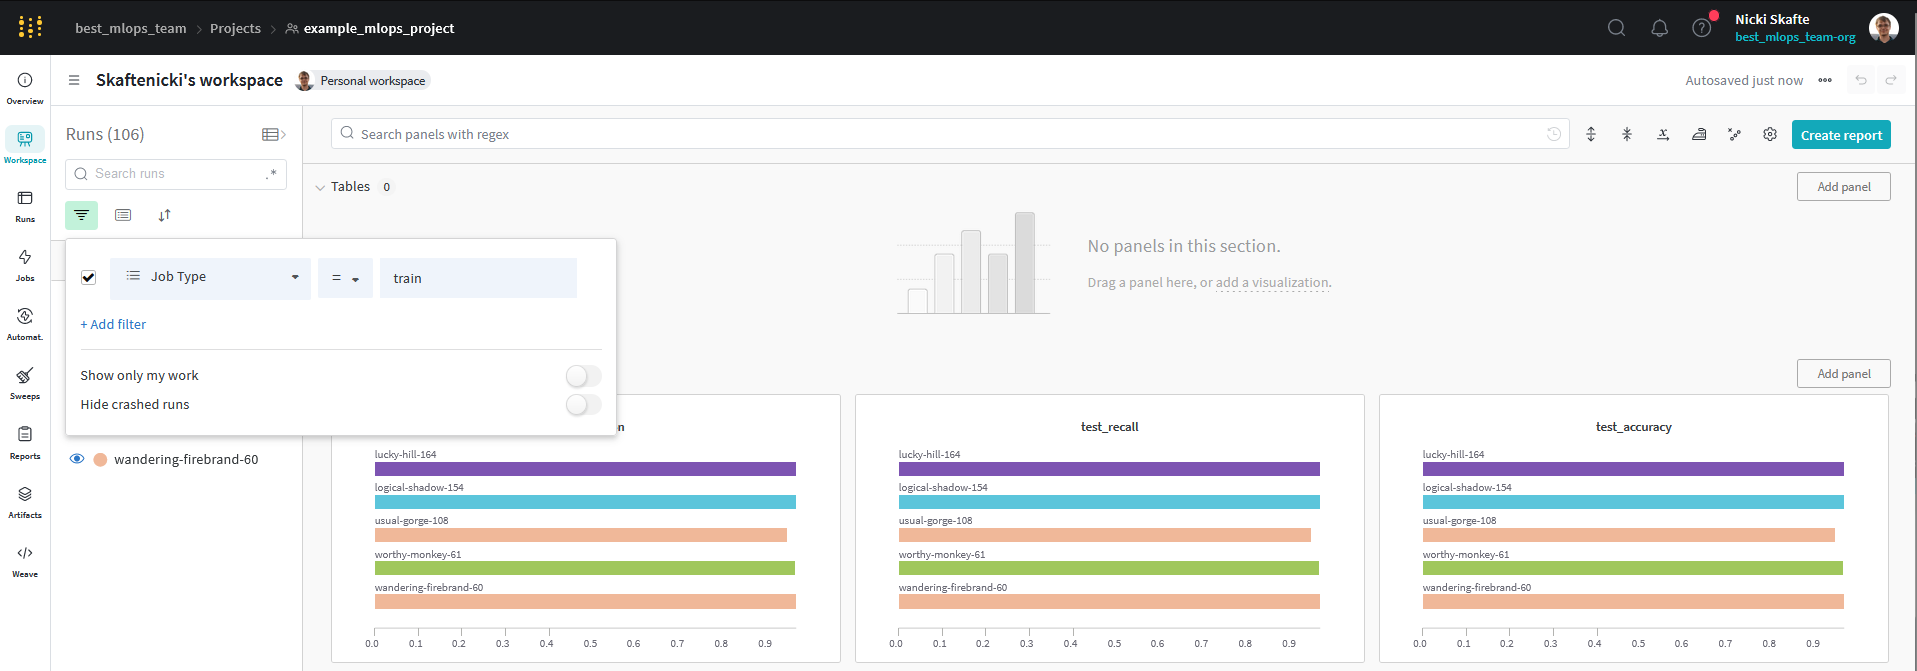
-
Wandb also comes with a built-in feature for doing hyperparameter sweeping which can be beneficial to get a better working model. Look through the documentation on how to do a hyperparameter sweep in Wandb. You at least need to create a new file called
sweep.yamland make sure that you callwandb.login your code on an appropriate value.-
Start by creating a
sweep.yamlfile. Relevant documentation can be found in the wandb sweeps configuration guide. We recommend placing the file in aconfigsfolder in your project.Solution
The
sweep.yamlfile will depend on the kind of hyperparameters your model accepts as arguments and how they are passed to the model. For this solution we assume that the model accepts the hyperparameterslr,batch_sizeandepochsand that they are passed as--args(with hyphens) (1) e.g. this would be how we run the script: If the script you want to run hyperparameter sweeping is configured using
hydra then you will need to change the default
If the script you want to run hyperparameter sweeping is configured using
hydra then you will need to change the default commandconfig in yoursweep.yamlfile. This is becausewandbuses--argsto pass hyperparameters to the script, whereashydrausesargs(without the hyphen). See this page for more information.
The
sweep.yamlcould then look like this: -
Afterwards, you need to create a sweep using the
wandb sweepcommand:This will output a sweep id that you need to use in the next step.
-
Finally, you need to run the sweep using the
wandb agentcommand:where
<sweep_id>is the id of the sweep you just created. You can find the id in the output of thewandb sweepcommand. The reason that we first lunch the sweep and then the agent is that we can have multiple agents running at the same time, parallelizing the search for the best hyperparameters. Try this out by opening a new terminal and running thewandb agentcommand again (with the same<sweep_id>). -
Inspect the sweep results in the wandb dashboard. You should see multiple new runs under the project you are logging the sweep to, corresponding to the different hyperparameters you tried. Make sure you understand the results and can answer what hyperparameters gave the best results and what hyperparameters had the largest impact on the results.
Solution
In the sweep dashboard you should see something like this:
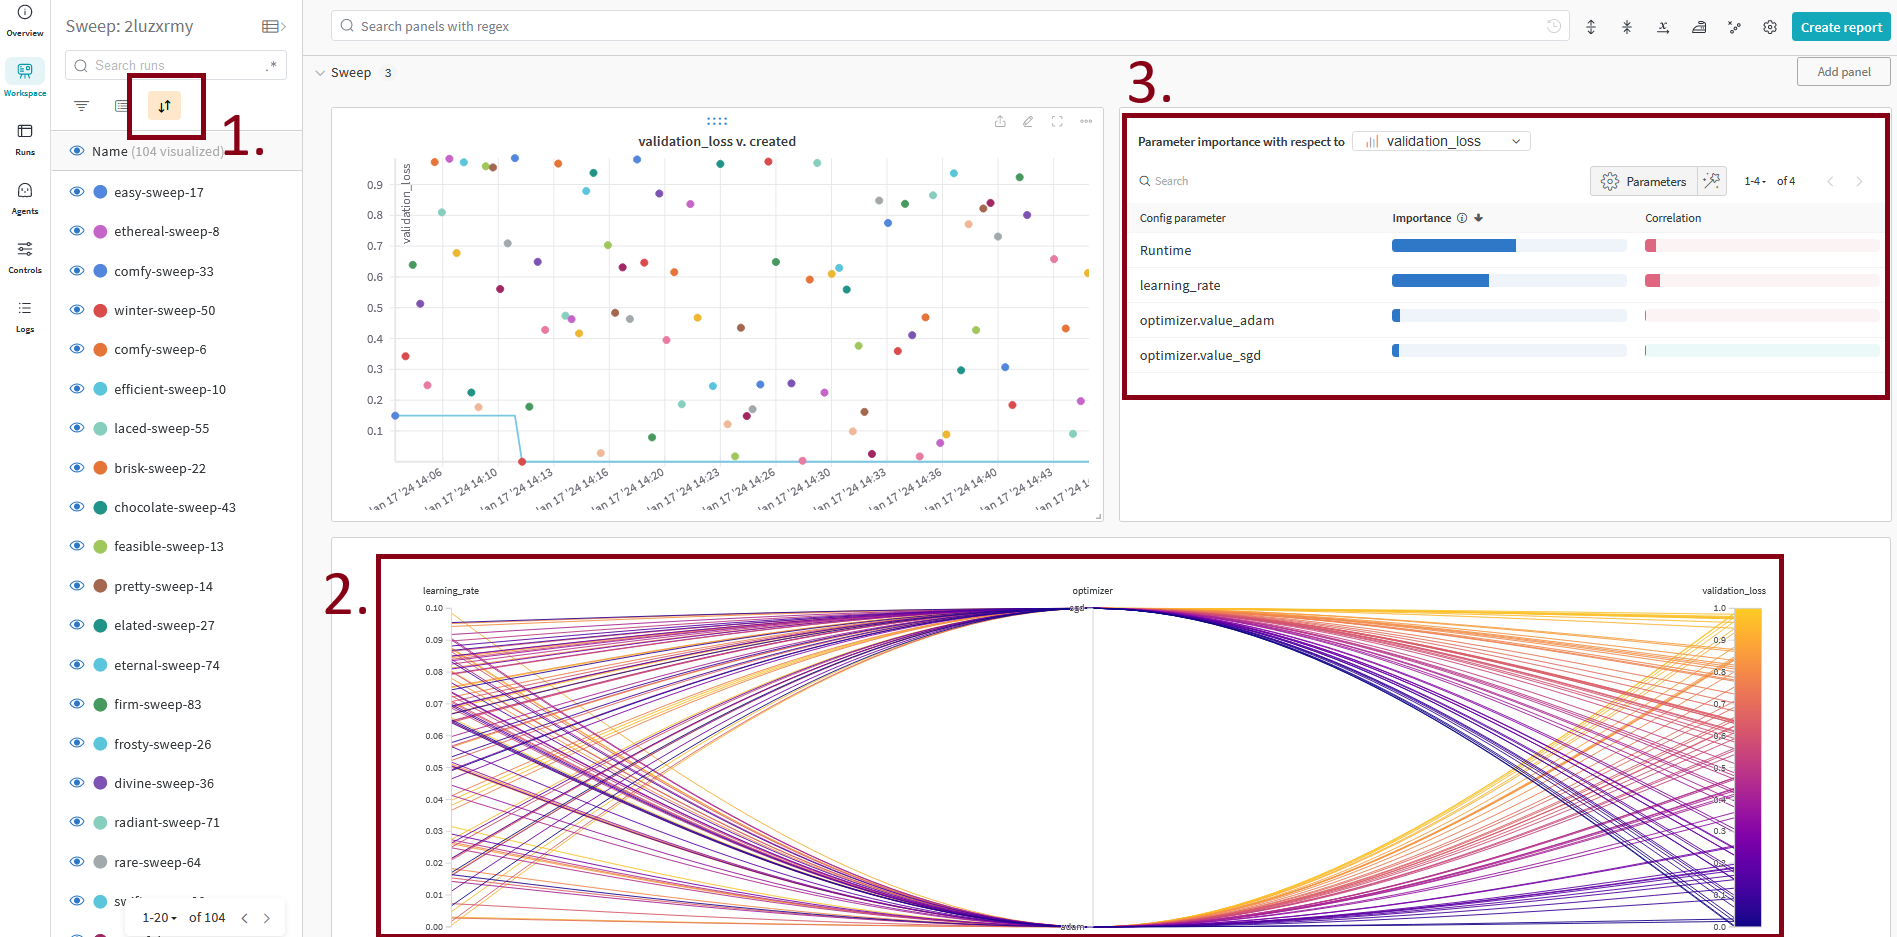
Importantly you can:
- Sort the runs based on what metric you are interested in, thereby quickly finding the best runs.
- Look at the parallel coordinates plot to see if there are any tendencies in the hyperparameters that give the best results.
- Look at the importance/correlation plot to see what hyperparameters have the largest impact on the results.
-
-
Next we need to understand the model registry, which will be very important later on when we get to the deployment of our models. The model registry is a centralized place for storing and versioning models. Importantly, any model in the registry is immutable, meaning that once a model is uploaded it cannot be changed. This is important for reproducibility and traceability of models.
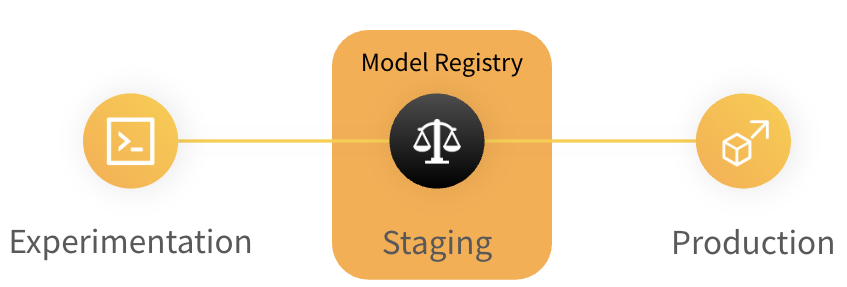
The model registry is in general a repository of a team's trained models where ML practitioners publish candidates for production and share them with others. Figure from wandb. -
The model registry builds on the artifact registry in wandb. Any model that is uploaded to the model registry is stored as an artifact. This means that we first need to log our trained models as artifacts before we can register them in the model registry. Make sure you have logged at least one model as an artifact before continuing.
-
Next let's create a registry. Go to the model registry tab (left pane, visible from your homepage) and then click the
Create Collectionbutton. Fill out the form:- Choose your personal account (you should create a team for the exam project and use that instead).
- Give the registry a name, e.g.
corrupt_mnist_models. - Provide a type of the registry, e.g.
model. - (Optional) Provide a description of the registry.
And click the create button.
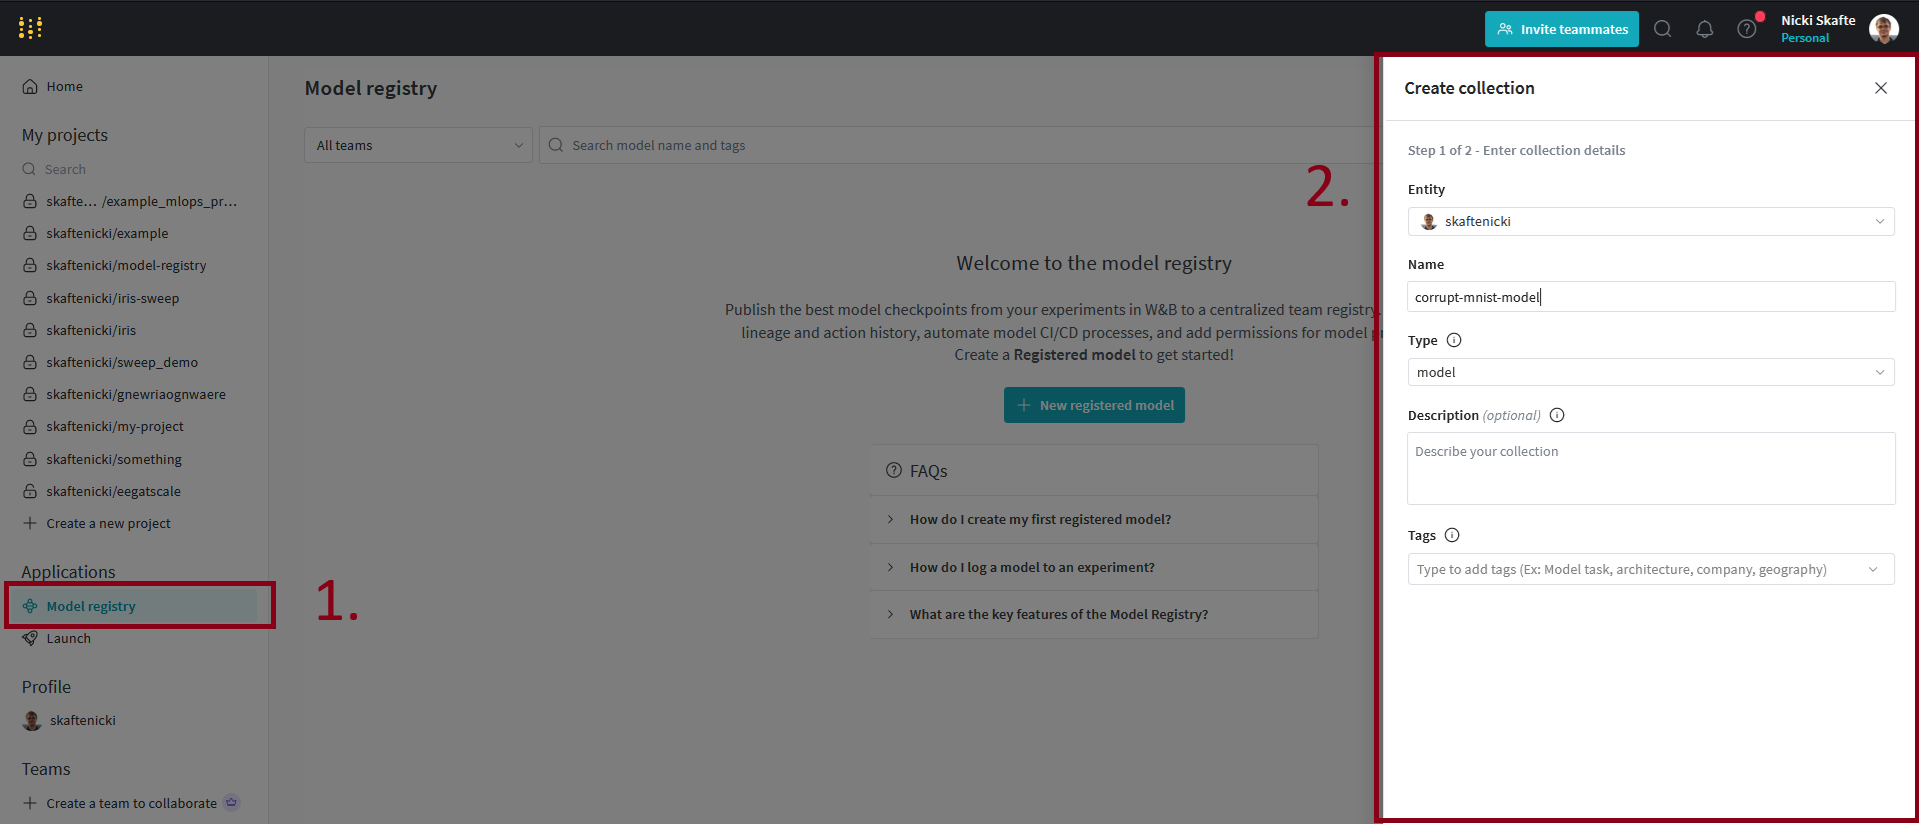
You should now see the collection/registry have been created.
-
When then need to link our artifact to the model registry we just created. We can do this in two ways: either through the web interface or through the
wandbAPI. In the web interface, go to the artifact you want to link to the model registry and click theLink to registrybutton (upper right corner). Assume you instead want to do the linking using the Python SDK, how would you do that?Solution
I would recommend two ways of linking:
-
Either this is done in the same script where the artifact is created and logged. In this case we can use the
run.link_artifactmethod: -
Alternatively, if we want to link an already existing artifact to the model registry we can use the
wandb.Apito do so. We create a new file calledlink_to_registry.pyfor this purpose:link_to_registry.py In the code
<entity>,<project>,<artifact_name>,<version>and<my_registry_name>should be replaced with the appropriate values.
-
-
We are now ready to consume our model, which can be done by downloading the artifact from the model registry. In this case we use the wandb API to download the artifact.
import wandb
api = wandb.Api()
artifact_name = f"<entity>/model-registry/<my_registry_name>:<alias>"
artifact = api.artifact(name = artifact_name)
artifact_dir = artifact.download("<artifact_dir>")
model = MyModel()
model.load_state_dict(torch.load("<artifact_dir>/model.ckpt"))
Try running this code with the appropriate values for
<entity>,<my_registry_name>,<version>and<artifact_dir>. Make sure that you can load the model and that it is the same as the one you trained. -
Each model in the registry has at least one alias, which is the version of the model. The most recently added model also receives the alias
latest. Aliases are great for indicating where in the workflow a model is, e.g. if it is a candidate for production or if it is a model that is still being developed. Try adding an alias to one of your models in the registry. -
(Optional) A model always corresponds to an artifact, and artifacts can contain metadata that we can use to automate the process of registering models. We could for example imagine that we at the end of each week run a script that registers the best model from the week. Try creating a small script using the
wandbAPI that goes over a collection of artifacts and registers the best one.Solution
-
-
In the future it will be important for us to be able to run Wandb inside a docker container (together with whatever training or inference we specify). The problem here is that we cannot authenticate Wandb in the same way as the previous exercise; it needs to happen automatically. Let's therefore look into how we can do that.
-
First we need to generate an authentication key, or more precisely an API key. This is in general the way any service (like a docker container) can authenticate. Start by going to https://wandb.ai/home, click your profile icon in the upper right corner and then go to
User settings. Scroll down to the danger zone and generate a new API key (if you do not already have one) and finally copy it. -
Next create a new dockerfile called
wandb.dockerand add the following codeand a new script called
wandb_tester.pythat contains the following codeimport random import wandb wandb.init(project="wandb-test") for _ in range(100): wandb.log({"test_metric": random.random()})and then build the docker image. These two files are just a very minimal setup to test that we can authenticate a docker container with Wandb.
-
When we want to run the image, what we need to do is include an environment variable that contains the API key we generated. This will then authenticate the docker container with the wandb server:
Try running it and confirm that the results are uploaded to the wandb server (1).
- If you have stored the API key in a
.envfile you can use the--env-fileflag instead of-eto load the environment variables from the file e.g.docker run --env-file .env wandb:latest.
-
-
Feel free to experiment more with
wandbas it is a great tool for logging, organizing and sharing experiments.
That is the module on logging. Please note that at this point in the course you will begin to see some overlap between
the different frameworks. While we mainly used hydra for configuring our Python scripts it can also be used to save
metrics and hyperparameters similar to how wandb can. Similar arguments hold for dvc which can also be used to
log metrics. In our opinion wandb just offers a better experience when interacting with the results after logging.
We want to stress that the combination of tools presented in this course may not be the best for all your future
projects, and we recommend finding a setup that works for you. That said, each framework provides specific features
that the others do not.
Finally, we want to note that while during the course we really try to showcase a lot of open-source frameworks, Wandb is not one. It is free to use for personal usage (with a few restrictions) but for enterprises it does require a license. If you are eager to only work with open-source tools we highly recommend trying out MLFlow, which offers the same overall functionalities as Wandb.