![]()
![]()
Monitoring
In this module we are going to look into more classical monitoring of applications. The key concept we are often working with here is called telemetry. Telemetry in general refers to any automatic measurement and wireless transmission of data from our application. It could be numbers such as:
- The number of requests our application receives per minute/hour/day. This number is of interest because it is directly proportional to the running cost of the application.
- The amount of time (on average) our application runs per request. The number is of interest because it most likely is the core contributor to the latency that our users experience (which we want to be low).
- ...
In general there are three different kinds of telemetry we are interested in:
| Name | Description | Example | Purpose |
|---|---|---|---|
| Metrics | Metrics are quantitative measurements of the system. They are usually numbers that are aggregated over a period of time. E.g. the number of requests per minute. | The number of requests per minute. | Metrics are used to get an overview of the system. They are often used to create dashboards that can be used to get an overview of the system. |
| Logs | Logs are textual or structured records generated by applications. They provide a detailed account of events, errors, warnings, and informational messages that occur during the operation of the system. | System logs, error logs | Logs are essential for diagnosing issues, debugging, and auditing. They provide a detailed history of what happened in a system, making it easier to trace the root cause of problems and track the behavior of components over time. |
| Traces | Traces are detailed records of specific transactions or events as they move through a system. A trace typically includes information about the sequence of operations, timing, and dependencies between different components. | Distributed tracing in microservices architecture | Traces help in understanding the flow of a request or a transaction across different components. They are valuable for identifying bottlenecks, understanding latency, and troubleshooting issues related to the flow of data or control. |
We are going to focus on metrics in this module, because that is the first kind of telemetry data that most people want to set up first.
Attaching metrics to an application
Let's start by looking at how we can attach metrics to an application and expose them afterwards. The standard framework
for exposing metrics is called prometheus. Prometheus is a time series database that is
designed to store metrics. It is also designed to be very easy to instrument applications with and it is designed to
scale to large amounts of data. The way prometheus works is that it exposes a /metrics endpoint that can be queried to
get the current state of the metrics. The metrics are exposed in a format called
prometheus text format.
❔ Exercises
-
Start by installing the Prometheus python client.
-
Before getting started on the coding part, we first need to understand the different kinds of metrics that Prometheus allows for us to specify. Look through the documentation and describe the different types of metrics that Prometheus allows for.
Solution
The different types of metrics that prometheus allows for are:
Counter: A counter is a cumulative metric that represents a single monotonically increasing counter whose value can only increase or be reset to zero on restart.Gauge: A gauge is a metric that represents a single numerical value that can arbitrarily go up and down. This is typically used for measured values like current memory usage, CPU usage, etc.Histogram: A histogram samples observations (usually things like request durations or response sizes) and counts them in configurable buckets. It also provides a sum of all observed values.Summary: Similar to a histogram, a summary samples observations (usually things like request durations and response sizes). While it also provides a total count of observations and a sum of all observed values, it calculates configurable quantiles over a sliding time window.
-
Assuming you have done the previous module on data drifting you should be familiar with the following API that uses a Bert model to classify the sentiment of a given review. The purpose of this exercise is to add some meaningful metrics to that API.
Sentiment API
sentiment_api.py 1 2 3 4 5 6 7 8 9 10 11 12 13 14 15 16 17 18 19 20 21 22 23 24 25 26 27 28 29 30 31 32 33 34 35 36 37 38 39 40 41 42 43 44 45 46 47 48 49 50 51 52 53 54 55 56 57 58 59 60 61 62 63 64 65 66 67 68 69 70 71 72 73 74 75 76 77 78 79 80 81 82 83 84 85 86 87 88 89 90 91 92 93 94 95 96 97 98 99 100 101 102 103 104 105 106 107 108 109 110 111 112 113 114 115 116 117 118 119 120 121 122 123 124 125 126 127 128
import datetime import json import os from contextlib import asynccontextmanager import torch import torch.nn as nn from fastapi import BackgroundTasks, FastAPI, HTTPException from google.cloud import storage from pydantic import BaseModel from transformers import BertModel, BertTokenizer # Define model and device configuration BUCKET_NAME = "gcp_monitoring_exercise" MODEL_NAME = "bert-base-cased" MODEL_FILE_NAME = "bert_sentiment_model.pt" device = torch.device("cuda" if torch.cuda.is_available() else "cpu") class ReviewInput(BaseModel): """Define input data structure for the endpoint.""" review: str class PredictionOutput(BaseModel): """Define output data structure for the endpoint.""" sentiment: str class SentimentClassifier(nn.Module): """Sentiment Classifier class. Combines BERT model with a dropout and linear layer.""" def __init__(self, n_classes, model_name=MODEL_NAME): super().__init__() self.bert = BertModel.from_pretrained(model_name) self.drop = nn.Dropout(p=0.3) self.out = nn.Linear(self.bert.config.hidden_size, n_classes) def forward(self, input_ids, attention_mask): """Forward pass of the model.""" output = self.bert(input_ids=input_ids, attention_mask=attention_mask) output = self.drop(output[1]) return self.out(output) @asynccontextmanager async def lifespan(app: FastAPI): """Load the model and tokenizer when the app starts and clean up when the app stops.""" global model, tokenizer, class_names if "bert_sentiment_model.pt" not in os.listdir(): download_model_from_gcp() # Download the model from GCP model = SentimentClassifier(n_classes=3) model.load_state_dict(torch.load("bert_sentiment_model.pt", map_location=device)) model = model.to(device) model.eval() tokenizer = BertTokenizer.from_pretrained(MODEL_NAME) class_names = ["negative", "neutral", "positive"] print("Model and tokenizer loaded successfully") yield del model, tokenizer # Initialize FastAPI app app = FastAPI(lifespan=lifespan) def download_model_from_gcp(): """Download the model from GCP bucket.""" client = storage.Client() bucket = client.bucket(BUCKET_NAME) blob = bucket.blob(MODEL_FILE_NAME) blob.download_to_filename(MODEL_FILE_NAME) print(f"Model {MODEL_FILE_NAME} downloaded from GCP bucket {BUCKET_NAME}.") # Save prediction results to GCP def save_prediction_to_gcp(review: str, outputs: list[float], sentiment: str): """Save the prediction results to GCP bucket.""" client = storage.Client() bucket = client.bucket(BUCKET_NAME) time = datetime.datetime.now(tz=datetime.UTC) # Prepare prediction data data = { "review": review, "sentiment": sentiment, "probability": outputs, "timestamp": datetime.datetime.now(tz=datetime.UTC).isoformat(), } blob = bucket.blob(f"prediction_{time}.json") blob.upload_from_string(json.dumps(data)) print("Prediction saved to GCP bucket.") # Prediction endpoint @app.post("/predict", response_model=PredictionOutput) async def predict_sentiment(review_input: ReviewInput, background_tasks: BackgroundTasks): """Predict sentiment of the input text.""" try: # Encode input text encoding = tokenizer.encode_plus( review_input.review, add_special_tokens=True, max_length=160, return_token_type_ids=False, padding="max_length", return_attention_mask=True, return_tensors="pt", ) input_ids = encoding["input_ids"].to(device) attention_mask = encoding["attention_mask"].to(device) # Model prediction with torch.no_grad(): outputs: torch.Tensor = model(input_ids, attention_mask) _, prediction = torch.max(outputs, dim=1) sentiment = class_names[prediction] background_tasks.add_task(save_prediction_to_gcp, review_input.review, outputs.softmax(-1).tolist(), sentiment) return PredictionOutput(sentiment=sentiment) except Exception as e: raise HTTPException(status_code=500, detail=str(e)) from eTo begin with you need to do the following: Add a single metric of the type
Counterthat counts the number of errors the API has encountered. Then, secondly add anapp.mountthat exposes the metrics on the/metricsendpoint. When you have done this you should be able to see the metrics by running the application and going to the/metricsendpoint. You can look at the documentation for help on how to do this.Solution
The important parts that implement the prometheus metrics are highlighted below:
1 2 3 4 5 6 7 8 9 10 11 12 13 14 15 16 17 18 19 20 21 22 23 24 25 26 27 28 29 30 31 32 33 34 35 36 37 38 39 40 41 42 43 44 45 46 47 48 49 50 51 52 53 54 55 56 57 58 59 60 61 62 63 64 65 66 67 68 69 70 71 72 73 74 75 76 77 78 79 80 81 82 83 84 85 86 87 88 89 90 91 92 93 94 95 96 97 98 99 100 101 102 103 104 105 106 107 108 109 110 111 112 113 114 115 116 117 118 119 120 121 122 123 124 125 126 127 128 129 130 131 132 133 134 135
import datetime import json import os from contextlib import asynccontextmanager import torch import torch.nn as nn from fastapi import BackgroundTasks, FastAPI, HTTPException from google.cloud import storage from prometheus_client import Counter, make_asgi_app from pydantic import BaseModel from transformers import BertModel, BertTokenizer # Define model and device configuration BUCKET_NAME = "gcp_monitoring_exercise" MODEL_NAME = "bert-base-cased" MODEL_FILE_NAME = "bert_sentiment_model.pt" device = torch.device("cuda" if torch.cuda.is_available() else "cpu") class ReviewInput(BaseModel): """Define input data structure for the endpoint.""" review: str class PredictionOutput(BaseModel): """Define output data structure for the endpoint.""" sentiment: str class SentimentClassifier(nn.Module): """Sentiment Classifier class. Combines BERT model with a dropout and linear layer.""" def __init__(self, n_classes, model_name=MODEL_NAME): super().__init__() self.bert = BertModel.from_pretrained(model_name) self.drop = nn.Dropout(p=0.3) self.out = nn.Linear(self.bert.config.hidden_size, n_classes) def forward(self, input_ids, attention_mask): """Forward pass of the model.""" output = self.bert(input_ids=input_ids, attention_mask=attention_mask) output = self.drop(output[1]) return self.out(output) # Define Prometheus metrics error_counter = Counter("prediction_error", "Number of prediction errors") @asynccontextmanager async def lifespan(app: FastAPI): """Load the model and tokenizer when the app starts and clean up when the app stops.""" global model, tokenizer, class_names if "bert_sentiment_model.pt" not in os.listdir(): download_model_from_gcp() # Download the model from GCP model = SentimentClassifier(n_classes=3) model.load_state_dict(torch.load("bert_sentiment_model.pt", map_location=device)) model = model.to(device) model.eval() tokenizer = BertTokenizer.from_pretrained(MODEL_NAME) class_names = ["negative", "neutral", "positive"] print("Model and tokenizer loaded successfully") yield del model, tokenizer # Initialize FastAPI app app = FastAPI(lifespan=lifespan) app.mount("/metrics", make_asgi_app()) def download_model_from_gcp(): """Download the model from GCP bucket.""" client = storage.Client() bucket = client.bucket(BUCKET_NAME) blob = bucket.blob(MODEL_FILE_NAME) blob.download_to_filename(MODEL_FILE_NAME) print(f"Model {MODEL_FILE_NAME} downloaded from GCP bucket {BUCKET_NAME}.") # Save prediction results to GCP def save_prediction_to_gcp(review: str, outputs: list[float], sentiment: str): """Save the prediction results to GCP bucket.""" client = storage.Client() bucket = client.bucket(BUCKET_NAME) time = datetime.datetime.now(tz=datetime.UTC) # Prepare prediction data data = { "review": review, "sentiment": sentiment, "probability": outputs, "timestamp": datetime.datetime.now(tz=datetime.UTC).isoformat(), } blob = bucket.blob(f"prediction_{time}.json") blob.upload_from_string(json.dumps(data)) print("Prediction saved to GCP bucket.") # Prediction endpoint @app.post("/predict", response_model=PredictionOutput) async def predict_sentiment(review_input: ReviewInput, background_tasks: BackgroundTasks): """Predict sentiment of the input text.""" try: # Encode input text encoding = tokenizer.encode_plus( review_input.review, add_special_tokens=True, max_length=160, return_token_type_ids=False, padding="max_length", return_attention_mask=True, return_tensors="pt", ) input_ids = encoding["input_ids"].to(device) attention_mask = encoding["attention_mask"].to(device) # Model prediction with torch.no_grad(): outputs: torch.Tensor = model(input_ids, attention_mask) _, prediction = torch.max(outputs, dim=1) sentiment = class_names[prediction] background_tasks.add_task(save_prediction_to_gcp, review_input.review, outputs.softmax(-1).tolist(), sentiment) return PredictionOutput(sentiment=sentiment) except Exception as e: error_counter.inc() raise HTTPException(status_code=500, detail=str(e)) from e-
If you have done the previous exercise correctly you should be seeing something like the image below.
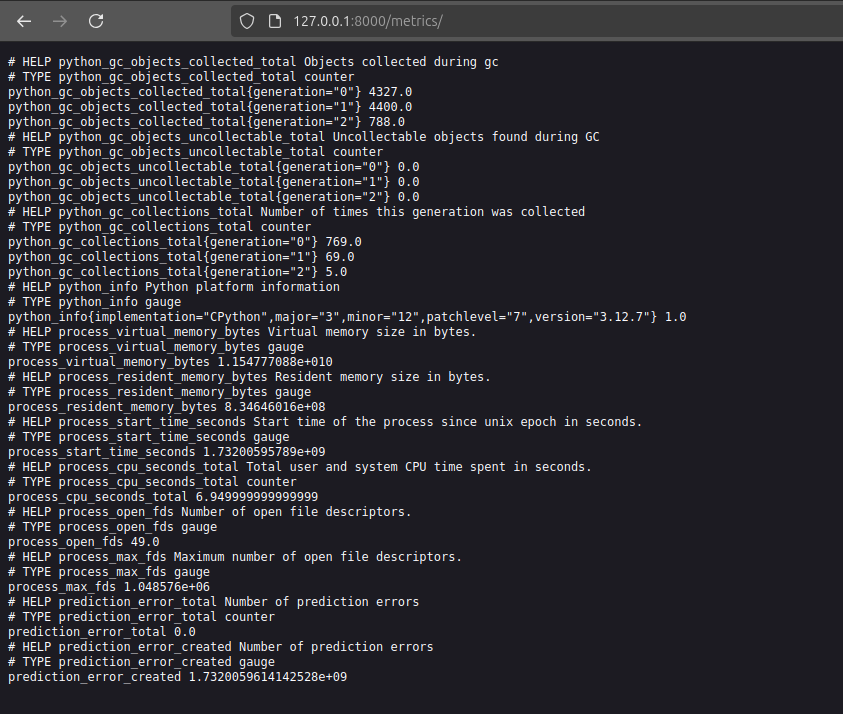
Figure out why there are many more metrics than the single one you added and try to make the metric you defined increase in value by sending error requests to the API.
Solution
All metrics in prometheus belong to a
registry. The registry is a collection of metrics. If you do not specify a registry when you create a metric like thisMY_REGISTRY = CollectorRegistry() my_counter = Counter('my_counter', 'This is my counter', registry=MY_REGISTRY)then the metric will be added to the default registry. The default registry already contains a lot of metrics that are added by the
prometheus-clientpackage. To only see the metrics that you have added you need to specify your own registry like above and only expose that registry on the/metricsendpoint.For the second part of the question you can increase the value of the counter by sending a request to the API that will raise an error. In this case the API will raise a 500 error if the review is too long. After this you should see the counter increase in value.
-
Next, we ask you to add a few more metrics to the API. Specifically we ask you to add the following metrics:
- Add a
Countermetric that counts the number of requests the API has received. - Add a
Histogrammetric that measures the time it takes to classify a review. - Add a
Summarymetric that measures the size of the reviews that are classified.
Confirm that everything works by running the application, sending a couple of requests to the API and then checking the
/metricsendpoint updates as expected.Solution
The important parts that implement the prometheus metrics are highlighted below:
1 2 3 4 5 6 7 8 9 10 11 12 13 14 15 16 17 18 19 20 21 22 23 24 25 26 27 28 29 30 31 32 33 34 35 36 37 38 39 40 41 42 43 44 45 46 47 48 49 50 51 52 53 54 55 56 57 58 59 60 61 62 63 64 65 66 67 68 69 70 71 72 73 74 75 76 77 78 79 80 81 82 83 84 85 86 87 88 89 90 91 92 93 94 95 96 97 98 99 100 101 102 103 104 105 106 107 108 109 110 111 112 113 114 115 116 117 118 119 120 121 122 123 124 125 126 127 128 129 130 131 132 133 134 135 136 137 138 139 140 141 142 143
import datetime import json import os from contextlib import asynccontextmanager import torch import torch.nn as nn from fastapi import BackgroundTasks, FastAPI, HTTPException from google.cloud import storage from prometheus_client import Counter, Histogram, Summary, make_asgi_app from pydantic import BaseModel from transformers import BertModel, BertTokenizer # Define model and device configuration BUCKET_NAME = "gcp_monitoring_exercise" MODEL_NAME = "bert-base-cased" MODEL_FILE_NAME = "bert_sentiment_model.pt" device = torch.device("cuda" if torch.cuda.is_available() else "cpu") class ReviewInput(BaseModel): """Define input data structure for the endpoint.""" review: str class PredictionOutput(BaseModel): """Define output data structure for the endpoint.""" sentiment: str class SentimentClassifier(nn.Module): """Sentiment Classifier class. Combines BERT model with a dropout and linear layer.""" def __init__(self, n_classes, model_name=MODEL_NAME): super().__init__() self.bert = BertModel.from_pretrained(model_name) self.drop = nn.Dropout(p=0.3) self.out = nn.Linear(self.bert.config.hidden_size, n_classes) def forward(self, input_ids, attention_mask): """Forward pass of the model.""" output = self.bert(input_ids=input_ids, attention_mask=attention_mask) output = self.drop(output[1]) return self.out(output) # Define Prometheus metrics error_counter = Counter("prediction_error", "Number of prediction errors") request_counter = Counter("prediction_requests", "Number of prediction requests") request_latency = Histogram("prediction_latency_seconds", "Prediction latency in seconds") review_summary = Summary("review_length_summary", "Review length summary") @asynccontextmanager async def lifespan(app: FastAPI): """Load the model and tokenizer when the app starts and clean up when the app stops.""" global model, tokenizer, class_names if "bert_sentiment_model.pt" not in os.listdir(): download_model_from_gcp() # Download the model from GCP model = SentimentClassifier(n_classes=3) model.load_state_dict(torch.load("bert_sentiment_model.pt", map_location=device)) model = model.to(device) model.eval() tokenizer = BertTokenizer.from_pretrained(MODEL_NAME) class_names = ["negative", "neutral", "positive"] print("Model and tokenizer loaded successfully") yield del model, tokenizer # Initialize FastAPI app app = FastAPI(lifespan=lifespan) app.mount("/metrics", make_asgi_app()) def download_model_from_gcp(): """Download the model from GCP bucket.""" client = storage.Client() bucket = client.bucket(BUCKET_NAME) blob = bucket.blob(MODEL_FILE_NAME) blob.download_to_filename(MODEL_FILE_NAME) print(f"Model {MODEL_FILE_NAME} downloaded from GCP bucket {BUCKET_NAME}.") # Save prediction results to GCP def save_prediction_to_gcp(review: str, outputs: list[float], sentiment: str): """Save the prediction results to GCP bucket.""" client = storage.Client() bucket = client.bucket(BUCKET_NAME) time = datetime.datetime.now(tz=datetime.UTC) # Prepare prediction data data = { "review": review, "sentiment": sentiment, "probability": outputs, "timestamp": datetime.datetime.now(tz=datetime.UTC).isoformat(), } blob = bucket.blob(f"prediction_{time}.json") blob.upload_from_string(json.dumps(data)) print("Prediction saved to GCP bucket.") # Prediction endpoint @app.post("/predict", response_model=PredictionOutput) async def predict_sentiment(review_input: ReviewInput, background_tasks: BackgroundTasks): """Predict sentiment of the input text.""" request_counter.inc() with request_latency.time(): try: review_summary.observe(len(review_input.review)) # Encode input text encoding = tokenizer.encode_plus( review_input.review, add_special_tokens=True, max_length=160, return_token_type_ids=False, padding="max_length", return_attention_mask=True, return_tensors="pt", ) input_ids = encoding["input_ids"].to(device) attention_mask = encoding["attention_mask"].to(device) # Model prediction with torch.no_grad(): outputs: torch.Tensor = model(input_ids, attention_mask) _, prediction = torch.max(outputs, dim=1) sentiment = class_names[prediction] background_tasks.add_task( save_prediction_to_gcp, review_input.review, outputs.softmax(-1).tolist(), sentiment ) return PredictionOutput(sentiment=sentiment) except Exception as e: error_counter.inc() raise HTTPException(status_code=500, detail=str(e)) from e - Add a
-
Write a small dockerfile that containerizes the application. Check that you can build the container and run it.
-
Hopefully from the exercise you have now seen how easy it is to add Prometheus metrics to an application. The next step is to look at how we can collect these metrics when the application is running in the cloud.
Cloud monitoring
Any cloud system with respect for itself will have some kind of monitoring system. GCP has a
service called Monitoring that is designed to monitor all the different services.
By default it will monitor a lot of metrics out-of-the-box. However, the question is if we want to monitor more than the
default metrics. The complexity that comes with doing monitoring in the cloud is that we need more than one container.
We at least need one container actually running the application that is also exposing the /metrics endpoint and then
we need a another container that is collecting the metrics from the first container and storing them in a database. To
implement such a system of containers that need to talk to each other we in general need to use a container orchestration
system such as Kubernetes. This is out of scope for this course, but we can use a feature
of Cloud Run called sidecar containers to achieve the same effect. A sidecar container is a container that is
running alongside the main container and can be used to do things such as collect metrics.
❔ Exercises
-
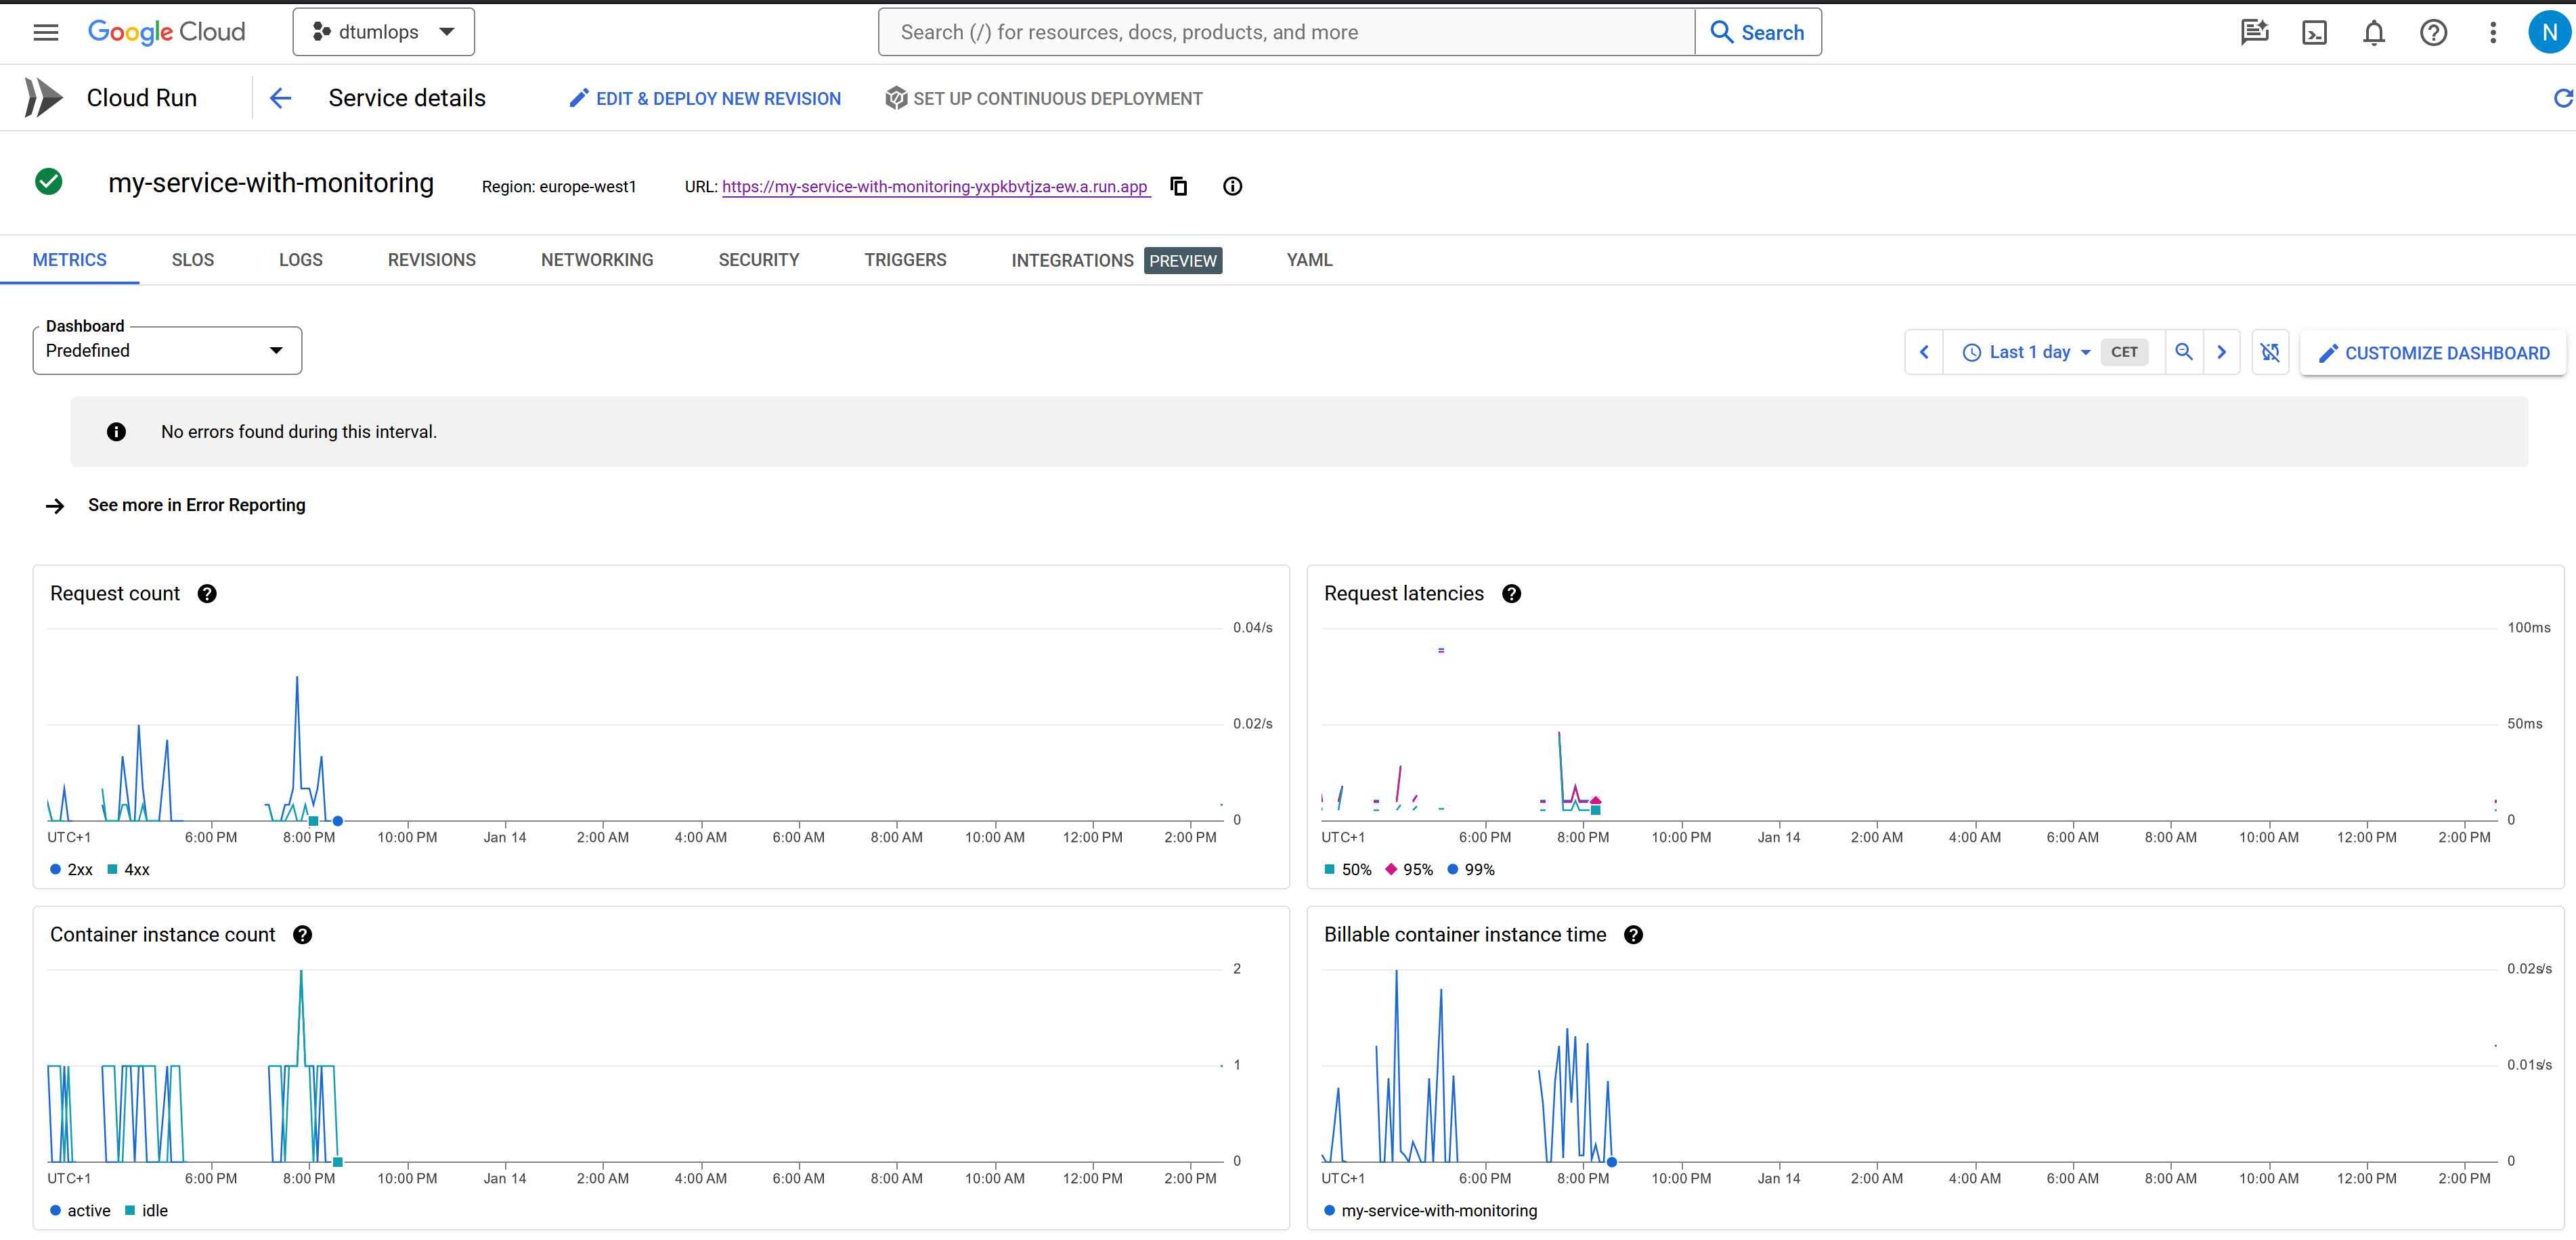
Overall we recommend that you just become familiar with the monitoring tab for your cloud run service (see image) above. Try to invoke your service a couple of times and see what happens to the metrics over time.
-
Try creating a service level objective (SLO). In short an SLO is a target for how well your application should be performing. Click the
Create SLObutton and fill it out with what you consider to be a good SLO for your application.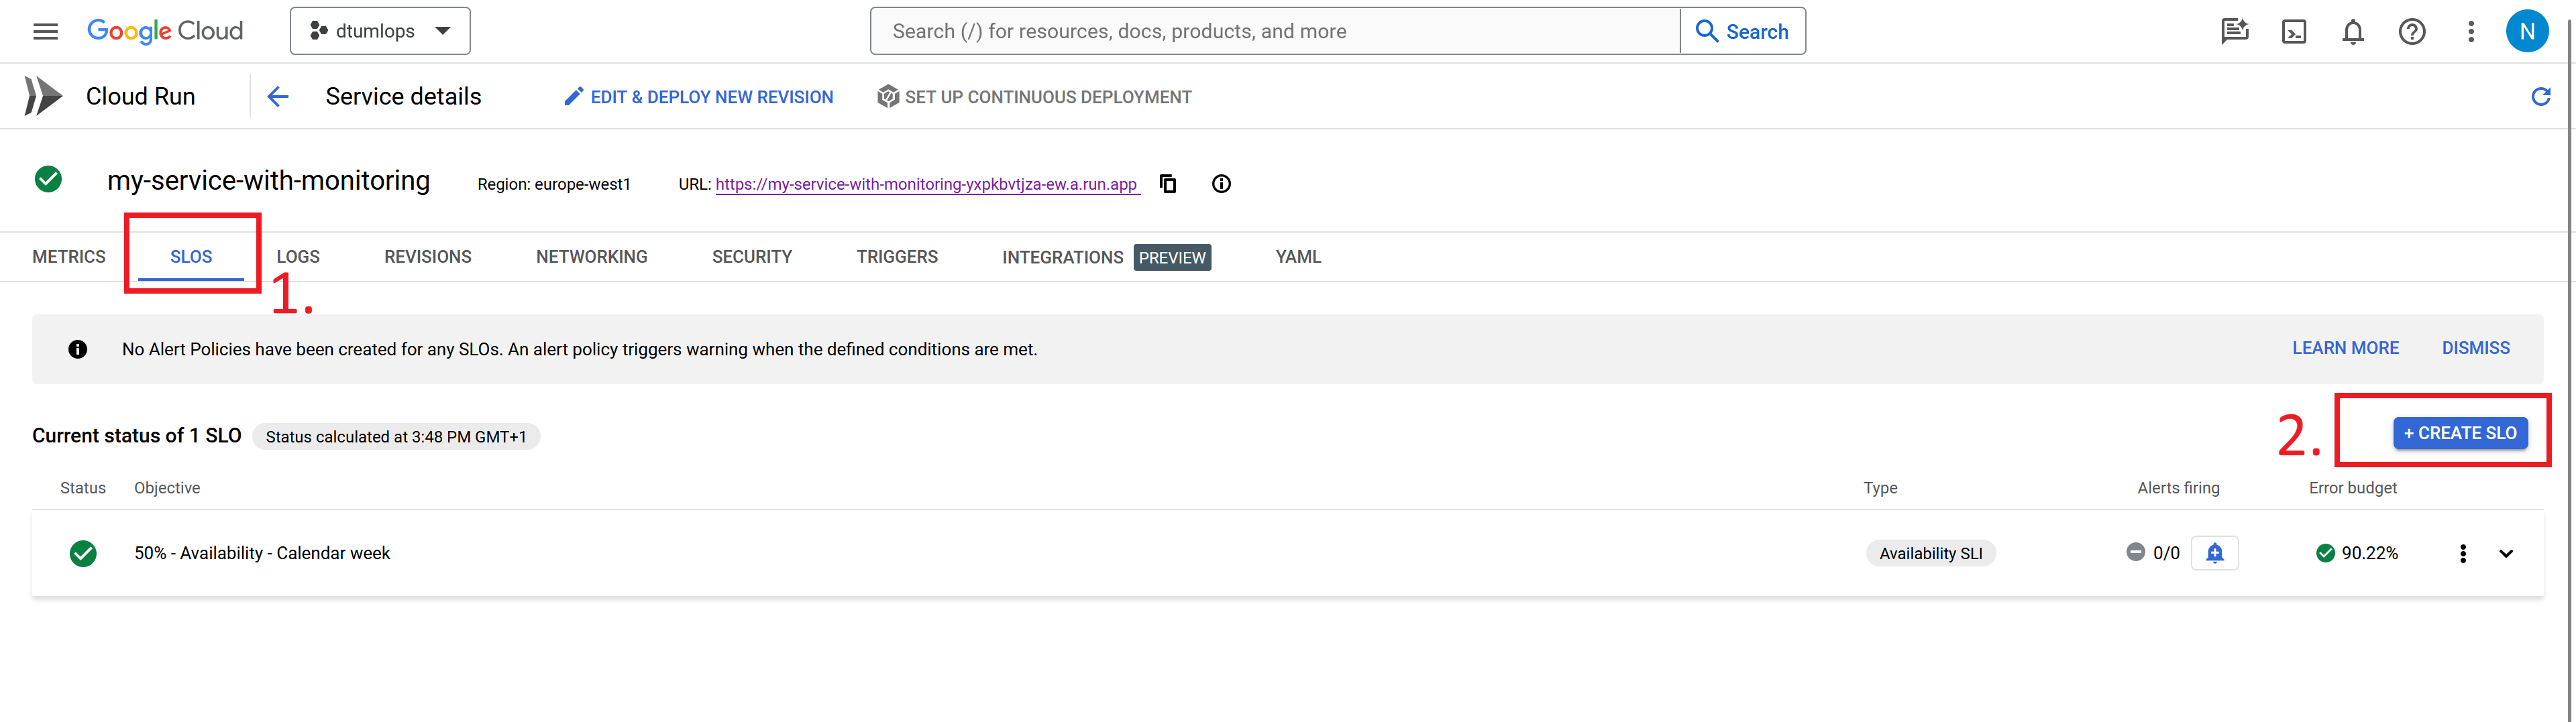
-
To expose our own metrics we need to set up a sidecar container. To do this follow the instructions in the Cloud Run sidecar guide. We have created a simple example that uses FastAPI and Prometheus that you can find in this example repository. After you have correctly created the sidecar container you should be able to see your custom metrics in the monitoring tab.
Alert systems
A core problem within monitoring is alert systems. The alert system is in charge of sending out alerts to relevant people when some telemetry or metric we are tracking is not behaving as it should. Alert systems are a subjective choice of when and how many should be sent out and in general should be proportional to the importance of the metric/telemetry. We commonly run into what is referred to the goldilocks problem where we want just the right amount of alerts, though it is more often the case that we either have
- Too many alerts, such that they become irrelevant and the really important ones are overseen, often referred to as alert fatigue
- Or alternatively, we have too few alerts and problems that should have triggered an alert are not dealt with when they happen which can have unforeseen consequences
Therefore, setting up proper alert systems can be as challenging as setting up the systems for the actual metrics we want to trigger alerts.
❔ Exercises
In this exercise we are going to look at how we can setup automatic alerting such that we get a message every time one of our applications is not behaving as expected.
-
Go to the
Monitoringservice. Then go to theAlertingtab.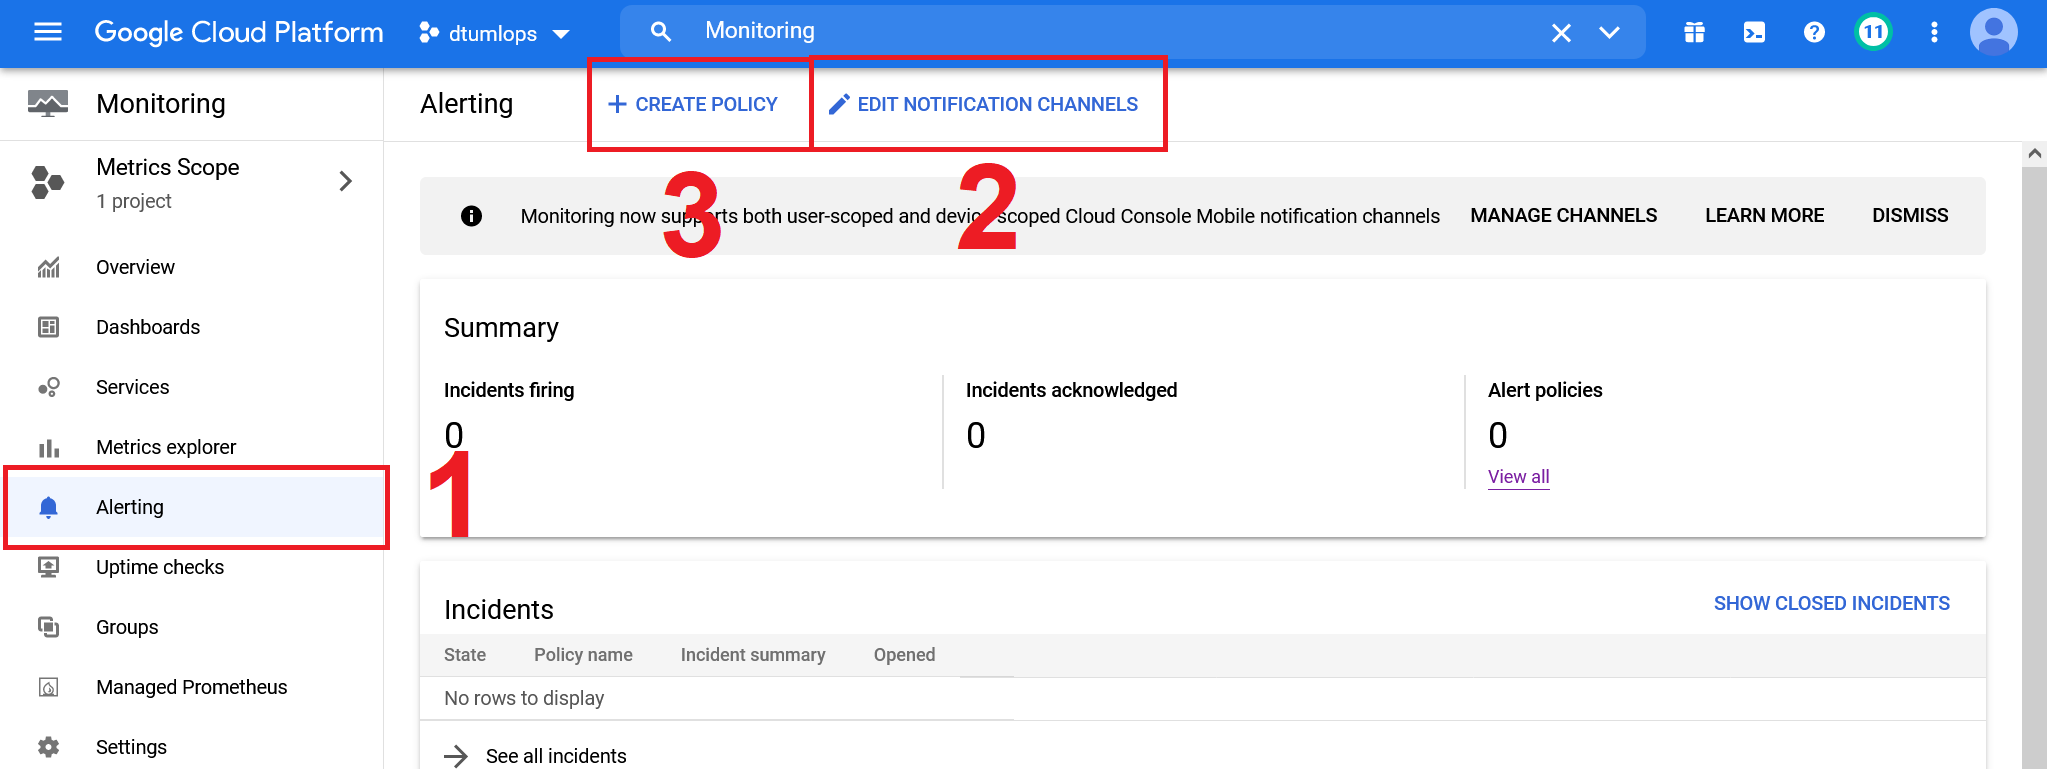
-
Start by setting up a notification channel. We recommend setting up with an email.
-
Next let's create a policy. Clicking the
Add Conditionshould bring up a window as below. You are free to set up the condition however you want but the image is one way to setup an alert that will react to the number of times a cloud function is invoked (actually it measures the number of log entries from cloud functions).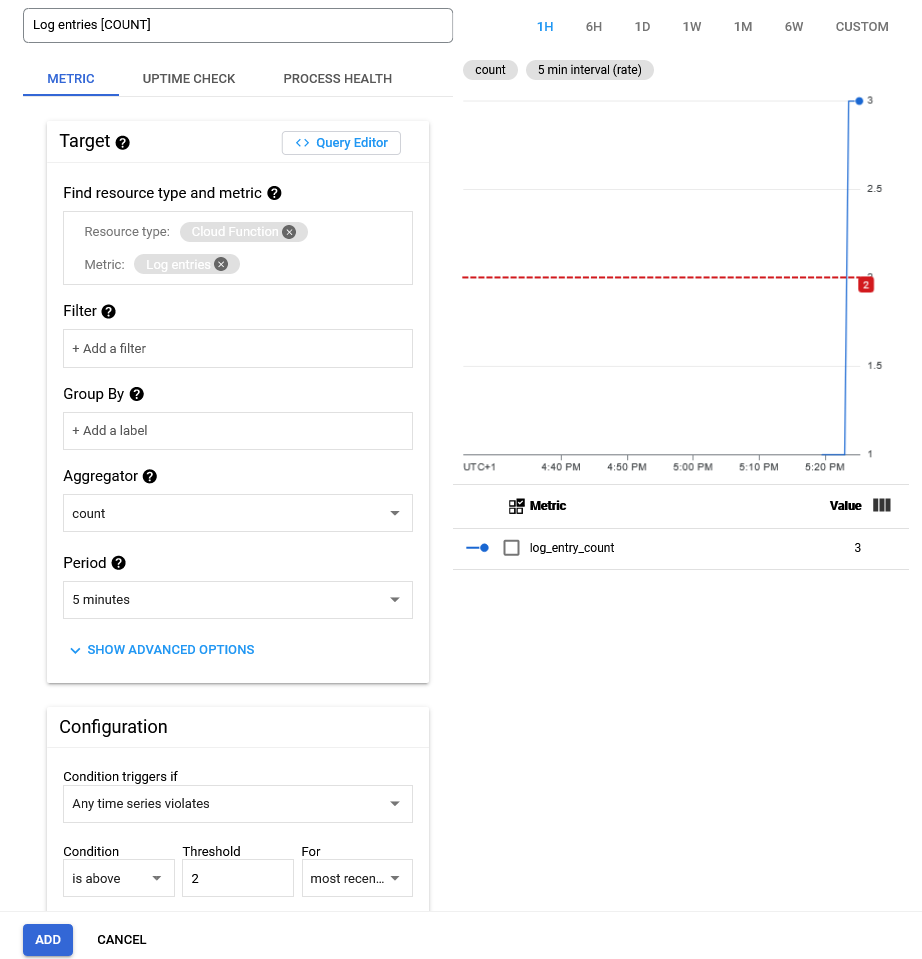
-
After adding the condition, add the notification channel you created in one of the earlier steps. Remember to also add some documentation that should be sent with the alert to better describe what the alert is actually doing.
-
When the alert is set up you need to trigger it. If you set up the condition as in the image above you just need to invoke the cloud function many times. Here is a small code snippet that you can execute on your laptop to call a cloud function many times (you need to change the URL and payload depending on your function):
-
Make sure that you get the alert through the notification channel you set up.