![]()
Profilers
Core Module
Profilers
In general profiling code is about improving the performance of your code. In this session we are going to take a somewhat narrow approach to what "performance" is: runtime, meaning the time it takes to execute your program.
At the bare minimum, the two questions a proper profiling of your program should be able to answer is:
- “ How many times is each method in my code called?”
- “ How long do each of these methods take?”
The first question can help us prioritize what to optimize. If two methods A and B have approximately the same
runtime, but A is called 1000 more times than B we should probably spend time optimizing A over B if we want
to speed up our code. The second question directly tells us which methods are expensive to call.
Using profilers can help you find bottlenecks in your code. In this exercise we will look at two different
profilers, with the first one being the cProfile. cProfile is
python's built-in profiler that can help give you an overview runtime of all the functions and methods involved in your
programs.
❔ Exercises
-
Run
cProfileon thevae_mnist_working.pyscript. Hint: you can directly call the profiler on a script using the-marg:To write the output to a file you can use the
-oargument:Script to debug
vae_mnist_working.py 1 2 3 4 5 6 7 8 9 10 11 12 13 14 15 16 17 18 19 20 21 22 23 24 25 26 27 28 29 30 31 32 33 34 35 36 37 38 39 40 41 42 43 44 45 46 47 48 49 50 51 52 53 54 55 56 57 58 59 60 61 62 63 64 65 66 67 68 69 70 71 72 73 74 75 76 77 78 79 80 81 82 83 84 85 86 87 88 89 90 91 92 93 94 95 96 97 98 99 100 101 102 103 104 105 106 107 108 109 110 111 112 113 114 115 116 117 118 119 120 121 122 123 124 125 126 127 128 129 130 131 132 133 134 135 136 137 138 139 140 141 142 143 144 145 146 147 148 149 150 151 152 153 154 155 156 157 158 159
"""Adapted from https://github.com/Jackson-Kang/Pytorch-VAE-tutorial/blob/master/01_Variational_AutoEncoder.ipynb. A simple implementation of Gaussian MLP Encoder and Decoder trained on MNIST """ import torch import torch.nn as nn import torchvision.transforms as transforms from torch.optim import Adam from torch.utils.data import DataLoader from torchvision.datasets import MNIST from torchvision.utils import save_image # Model Hyperparameters dataset_path = "datasets" DEVICE = torch.device("cuda" if torch.cuda.is_available() else "mps" if torch.backends.mps.is_available() else "cpu") batch_size = 100 x_dim = 784 hidden_dim = 400 latent_dim = 20 lr = 1e-3 epochs = 5 # Data loading mnist_transform = transforms.Compose([transforms.ToTensor()]) train_dataset = MNIST(dataset_path, transform=mnist_transform, train=True, download=True) test_dataset = MNIST(dataset_path, transform=mnist_transform, train=False, download=True) train_loader = DataLoader(dataset=train_dataset, batch_size=batch_size, shuffle=True) test_loader = DataLoader(dataset=test_dataset, batch_size=batch_size, shuffle=False) class Encoder(nn.Module): """Gaussian MLP Encoder.""" def __init__(self, input_dim, hidden_dim, latent_dim) -> None: super().__init__() self.FC_input = nn.Linear(input_dim, hidden_dim) self.FC_mean = nn.Linear(hidden_dim, latent_dim) self.FC_var = nn.Linear(hidden_dim, latent_dim) self.training = True def forward(self, x): """Forward pass.""" h_ = torch.relu(self.FC_input(x)) mean = self.FC_mean(h_) log_var = self.FC_var(h_) std = torch.exp(0.5 * log_var) z = self.reparameterization(mean, std) return z, mean, log_var def reparameterization(self, mean, std): """Reparameterization trick.""" epsilon = torch.randn_like(std) return mean + std * epsilon class Decoder(nn.Module): """Bernoulli MLP Decoder.""" def __init__(self, latent_dim, hidden_dim, output_dim) -> None: super().__init__() self.FC_hidden = nn.Linear(latent_dim, hidden_dim) self.FC_output = nn.Linear(hidden_dim, output_dim) def forward(self, x): """Forward pass.""" h = torch.relu(self.FC_hidden(x)) return torch.sigmoid(self.FC_output(h)) class Model(nn.Module): """VAE Model.""" def __init__(self, encoder, decoder) -> None: super().__init__() self.encoder = encoder self.decoder = decoder def forward(self, x): """Forward pass.""" z, mean, log_var = self.encoder(x) x_hat = self.decoder(z) return x_hat, mean, log_var encoder = Encoder(input_dim=x_dim, hidden_dim=hidden_dim, latent_dim=latent_dim) decoder = Decoder(latent_dim=latent_dim, hidden_dim=hidden_dim, output_dim=x_dim) model = Model(encoder=encoder, decoder=decoder).to(DEVICE) BCE_loss = nn.BCELoss() def loss_function(x, x_hat, mean, log_var): """Reconstruction + KL divergence losses summed over all elements and batch.""" reproduction_loss = nn.functional.binary_cross_entropy(x_hat, x, reduction="sum") kld = -0.5 * torch.sum(1 + log_var - mean.pow(2) - log_var.exp()) return reproduction_loss + kld optimizer = Adam(model.parameters(), lr=lr) print("Start training VAE...") model.train() for epoch in range(epochs): overall_loss = 0 for batch_idx, (x, _) in enumerate(train_loader): if batch_idx % 100 == 0: print(batch_idx) x = x.view(batch_size, x_dim) x = x.to(DEVICE) optimizer.zero_grad() x_hat, mean, log_var = model(x) loss = loss_function(x, x_hat, mean, log_var) overall_loss += loss.item() loss.backward() optimizer.step() print( "\tEpoch", epoch + 1, "complete!", "\tAverage Loss: ", overall_loss / (batch_idx * batch_size), ) print("Finish!!") # Generate reconstructions model.eval() with torch.no_grad(): for batch_idx, (x, _) in enumerate(test_loader): if batch_idx % 100 == 0: print(batch_idx) x = x.view(batch_size, x_dim) x = x.to(DEVICE) x_hat, _, _ = model(x) break save_image(x.view(batch_size, 1, 28, 28), "orig_data.png") save_image(x_hat.view(batch_size, 1, 28, 28), "reconstructions.png") # Generate samples with torch.no_grad(): noise = torch.randn(batch_size, latent_dim).to(DEVICE) generated_images = decoder(noise) save_image(generated_images.view(batch_size, 1, 28, 28), "generated_sample.png") -
Try looking at the output of the profiling. Can you figure out which function took the longest to run? How do you show the content of the
profile.txtfile?Solution
If you try to open
profile.txtin a text editor you will see that it is not very human-readable. To get a better overview of the profiling you can use thepstatsmodule to read the file and print the results in a more readable format. For example, to print the 10 functions that took the longest time to run you can use the following code: -
Can you explain the difference between
tottimeandcumtime? Under what circumstances do these differ and when are they equal?Solution
tottimeis the total time spent in the function excluding time spent in subfunctions.cumtimeis the total time spent in the function including time spent in subfunctions. Therefore,cumtimeis always greater thantottime. -
To get a better feeling of the profiled result we can try to visualize it. Python does not provide a native solution, but open-source solutions such as snakeviz exist. Try installing
snakevizand load a profiled run into it (HINT: snakeviz expects the run to have the file format.prof). -
Try optimizing the run! (Hint: The data is not stored as a torch tensor). After optimizing the code make sure (using
cProfileandsnakeviz) that the code actually runs faster.Solution
For consistency reasons, even though the data in the
MNISTdataset class fromtorchvisionis stored as tensors, they are converted to PIL images before being returned. This is the reason the solution is to initialize the dataclass with the transformsuch that the data is returned as tensors. However, since the data is already stored as tensors, calling this transform every time you want to access the data is redundant and can be removed. The easiest way to do this is to create a
TensorDatasetfrom the internal data and labels (which are already tensors).from torchvision.datasets import MNIST from torch.utils.data import TensorDataset # the class also internally normalize to [0,1] domain so we need to divide by 255 train_dataset = MNIST(dataset_path, train=True, download=True) train_dataset = TensorDataset(train_dataset.data.float() / 255.0, train_dataset.targets) test_dataset = MNIST(dataset_path, train=False, download=True) test_dataset = TensorDataset(test_dataset.data.float() / 255.0, test_dataset.targets)
PyTorch profiling
Profiling machine learning code can become much more complex because we are suddenly beginning to mix different devices (CPU+GPU), which can (and should) overlap in some of their computations. When profiling this kind of machine learning code we are often looking for bottlenecks. A bottleneck is simply a place in your code that is preventing other processes from performing their best. This is the reason that all major deep learning frameworks also include their own profilers that can help profiling more complex applications.
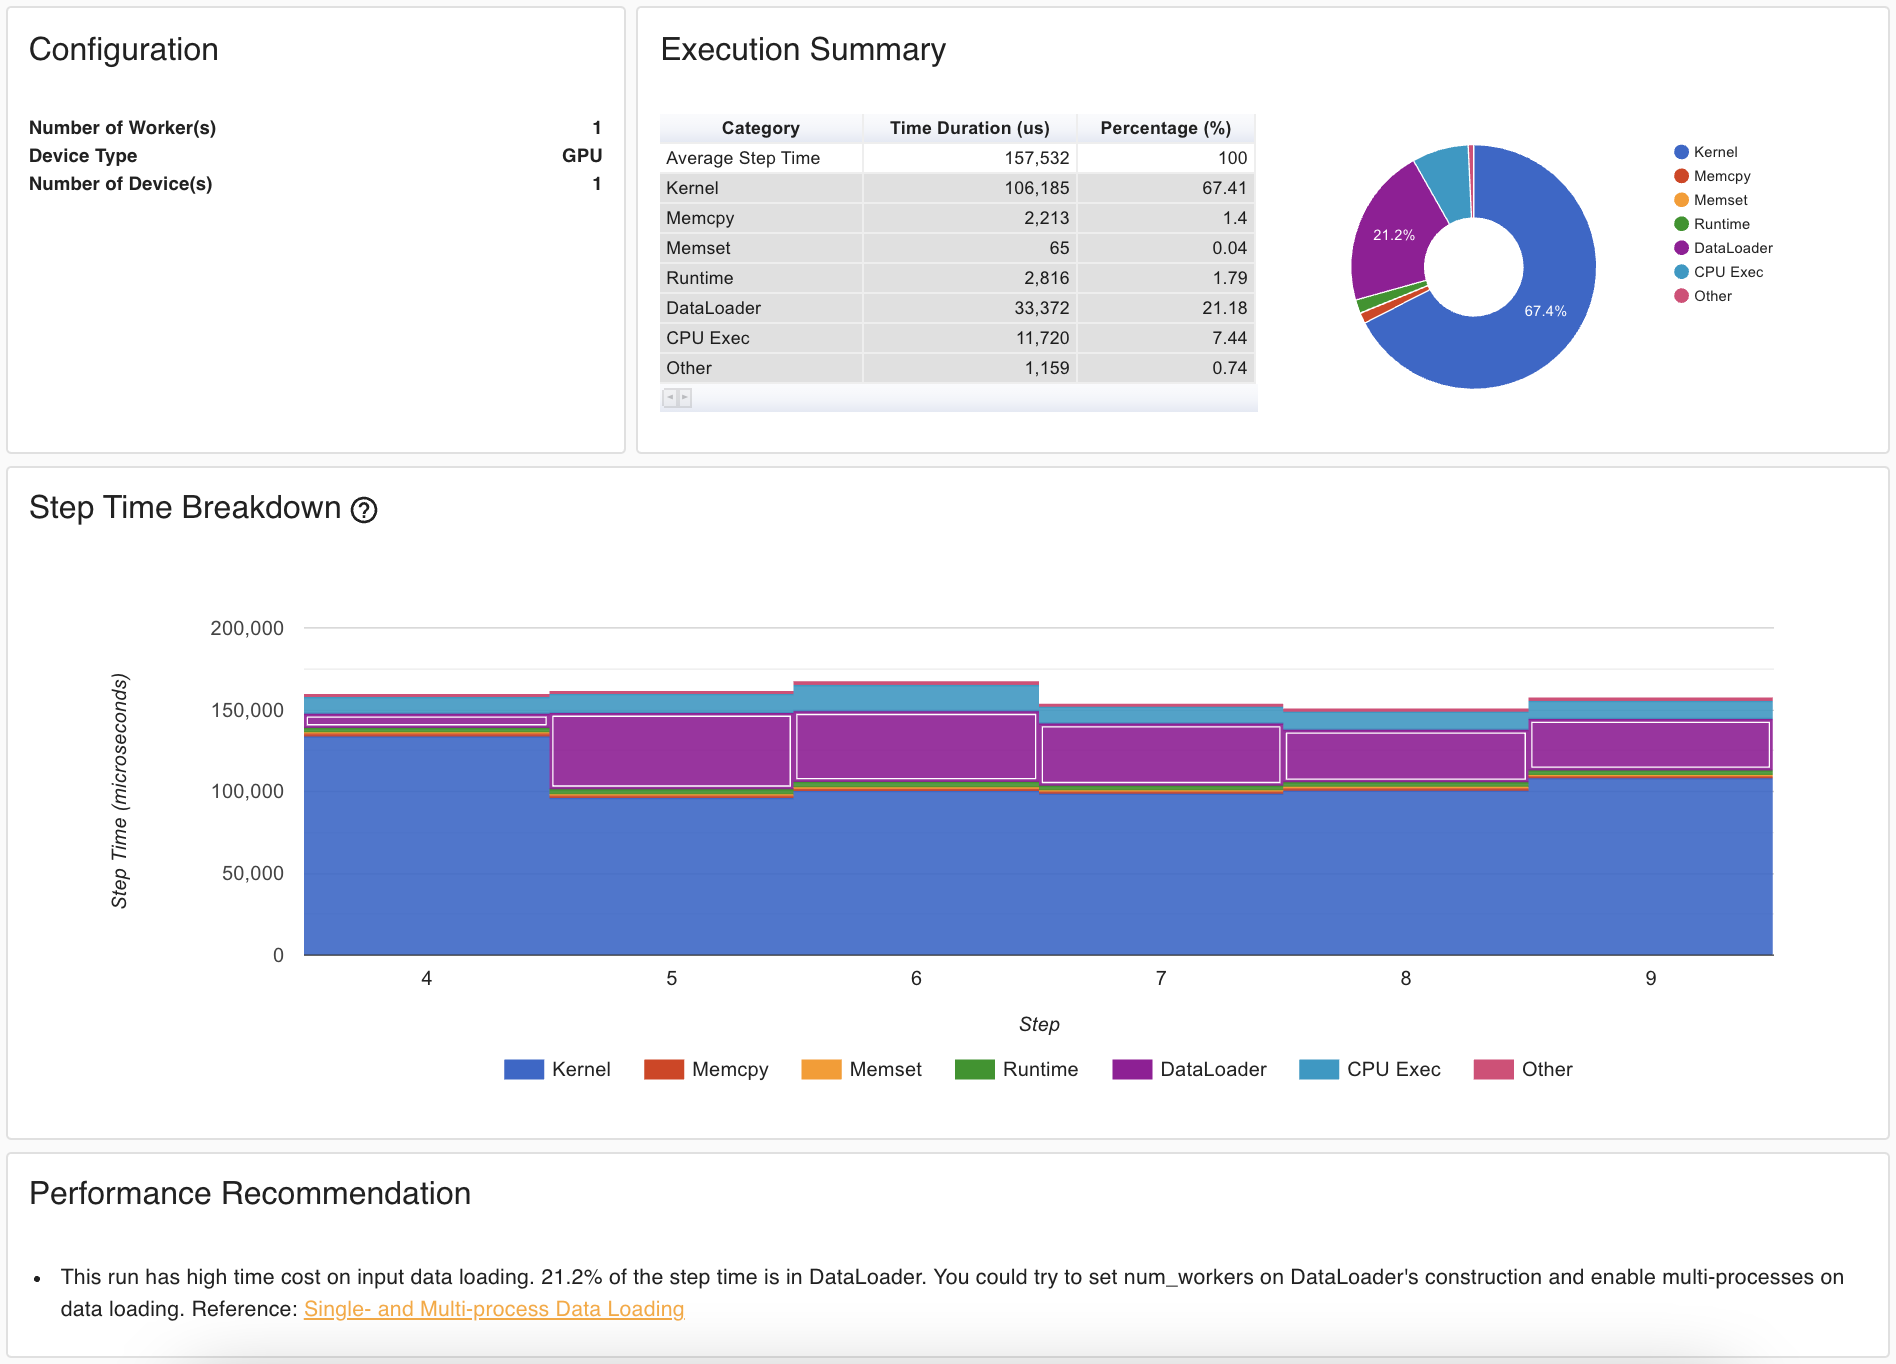
The image below show a typical report using the
built-in profiler in pytorch.
As the image shows, the profiler looks both at the kernel time (this is the time spent doing actual computations)
and also transfer times such as memcpy (where we are copying data between devices).
It can even analyze your code and give recommendations.
Using the profiler can be as simple as wrapping the code that you want to profile with the torch.profiler.profile
decorator:
❔ Exercises
In these investigate the profiler that is build into PyTorch already. Note that these exercises require that you have PyTorch v1.8.1 installed (or higher). You can always check which version you currently have installed by writing (in a python interpreter):
But we always recommend updating to the latest PyTorch version for the best experience. Additionally, to display the
result nicely (like snakeviz for cProfile) we are also going to use the tensorboard profiler extension.
-
A good starting point is to look at the API for the profiler. Here the important class to look at is the
torch.profiler.profileclass. -
Let's try out a simple example (taken from the PyTorch profiler recipe):
-
Try to run the following code:
import torch
import torchvision.models as models
from torch.profiler import profile, ProfilerActivity

model = models.resnet18()
inputs = torch.randn(5, 3, 224, 224)

with profile(activities=[ProfilerActivity.CPU], record_shapes=True) as prof:
    model(inputs)
This will profile the
forwardpass of a Resnet 18 model. -
Running this code will produce a
profobject that contains all the relevant information about the profiling. Try writing the following code:What operation is using most of the cpu?
-
Try running
Can you see any correlation between the shape of the input and the cost of the operation?
-
(Optional) If you have a GPU you can also profile the operations on that device:
-
(Optional) As an alternative to using
profileas a context-manager, we can also use its.startand.stopmethods:Try doing this on the above example.
-
-
The
torch.profiler.profilefunction takes some additional arguments. What argument would you need to set to also profile the memory usage? (Hint: this page) Try doing it on the simple example above and make sure to sort the samples byself_cpu_memory_usage. -
As mentioned we can also get a graphical output for better inspection. After having done profiling try to export the results with:
You should be able to visualize the file by going to
chrome://tracingin any chromium-based web browser (provided you have enabled internal debugging pages at chrome://chrome-urls). Can you still identify the information printed in the previous exercises from the visualizations? -
Running profiling on a single forward step can produce misleading results, as it only provides a single sample that may depend on what background processes are running on your computer. Therefore it is recommended to profile multiple iterations of your model. If this is the case then we need to include
prof.step()to tell the profiler when we are doing a new iteration.Try doing this. Is the conclusion the same on what operations are taking up most of the time? Have the percentages changed significantly?
-
Additionally, we can also visualize the profiling results using the profiling viewer in tensorboard.
-
Start by initializing the
profileclass with an additional argument:from torch.profiler import profile, tensorboard_trace_handler with profile(..., on_trace_ready=tensorboard_trace_handler("./log/resnet18")) as prof: ...Try running profiling (using a couple of iterations) and make sure that a file with the
.pt.trace.jsonis produced in thelog/resnet18folder. -
Now try launching tensorboard
and open the page http://localhost:6006/#pytorch_profiler, where you should hopefully see an image similar to the one below:
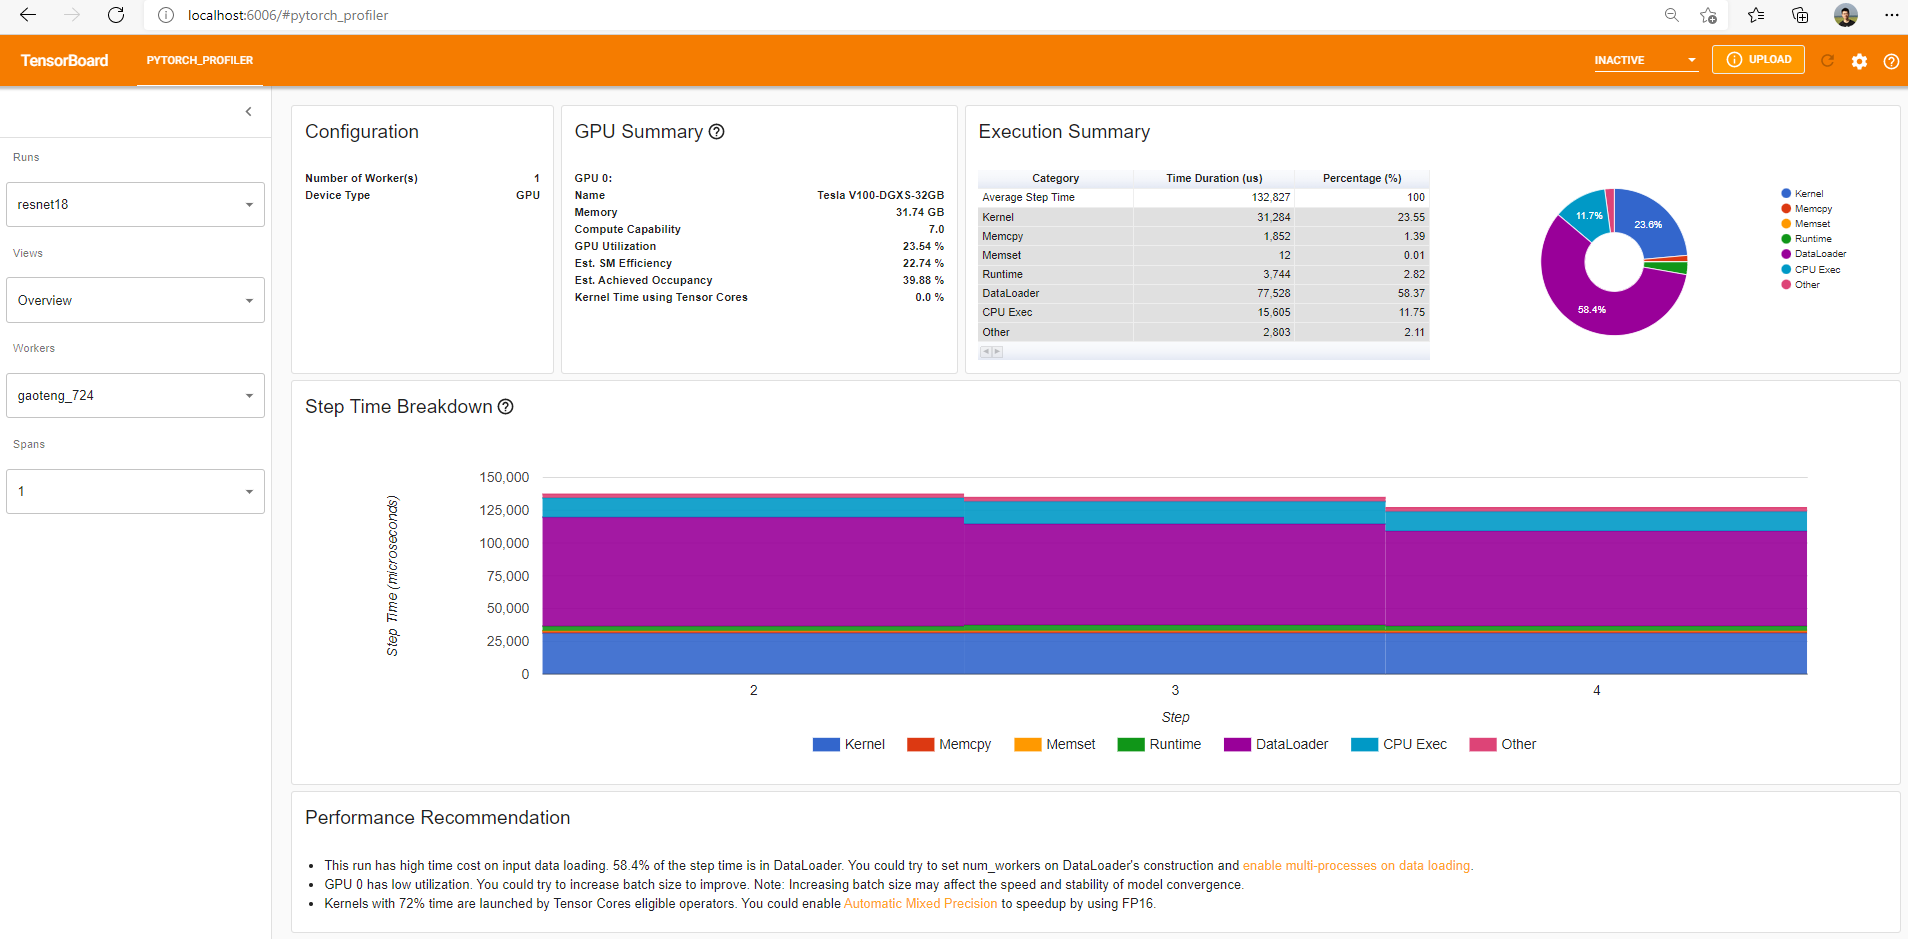
Image credit Try poking around in the interface.
-
Tensorboard has a nice feature for comparing runs under the
difftab. Try redoing a profiling run but usemodel = models.resnet34()instead. Load up both runs and try to look at thediffbetween them.
-
-
As a final exercise, try to use the profiler on the
vae_mnist_working.pyfile from the previous module on debugging, where you profile a whole training run (not only the forward pass). What is the bottleneck during the training? Is it still the forward pass or is it something else? Can you improve the code somehow based on the information from the profiler?
This ends the module on profiling. If you want to go into more details on this topic we recommend looking into
line_profiler and kernprof. A downside of using python's cProfile is that
it can only profile at a functional/modular level, which is great for identifying hotspots in your code. However,
sometimes the cause of a computational hotspot is a single line of code in a function, which will not be caught by
cProfile. An example would be a simple index operation such as a[idx] = b, which for large arrays and
non-sequential indexes is really expensive. For these cases
line_profiler and kernprof are excellent tools to have in your toolbox.
Additionally, if you do not like cProfile we also recommend py-spy, which is
another open-source profiling tool for Python programs.